Total Usual Nutrient Intakes of US Children (Under 48 Months): Findings from the Feeding Infants and Toddlers Study (FITS) 2016


Total Usual Nutrient Intakes of US Children (Under 48 Months): Findings from the Feeding Infants and Toddlers Study (FITS) 2016
Regan L Bailey, Diane J Catellier, Shinyoung Jun, Johanna T Dwyer, Emma F Jacquier, Andrea S Anater, and Alison L Eldridge
Keywords:
nutritional epidemiology, Feeding Infants and Children Survey, FITS 2016, usual nutrient intake, dietary intake, supplement use, infants, toddlers
Abstract
Background: The US Dietary Guidelines will expand in 2020 to include infants and toddlers. Understanding current dietary intakes is critical to inform policy.
Objective: The purpose of this analysis was to examine the usual total nutrient intakes from diet and supplements among US children.
Methods: The Feeding Infants and Toddlers Study 2016 is a national cross-sectional study of children aged <48 mo (n = 3235): younger infants (birth to 5.9 mo), older infants (6–11.9 mo), toddlers (12–23.9 mo), younger preschoolers (24–36.9 mo), and older preschoolers (36–47.9 mo) based on the use of a 24-h dietary recall. A second 24-h recall was collected from a representative subsample (n = 799). Energy, total nutrient intake distributions, and compliance with Dietary Reference Intakes were estimated with the use of the National Cancer Institute method.
Results: Dietary supplement use was 15–23% among infants and toddlers and 35–45% among preschoolers. Dietary intakes of infants were adequate, with mean intakes exceeding Adequate Intake for all nutrients except vitamins D and E. Iron intakes fell below the Estimated Average Requirement for older infants (18%). We found that 31–33% of children aged 12–47.9 mo had low percentage of energy from total fat, and >60% of children aged 24–47.9 mo exceeded the saturated fat guidelines. The likelihood of nutrient inadequacy for many nutrients was higher for toddlers: 3.2% and 2.5% greater than the Adequate Intake for fiber and potassium and 76% and 52% less than the Estimated Average Requirement for vitamins D and E, respectively. These patterns continued through older ages. Intakes exceeded the Tolerable Upper Intake Level of sodium, retinol, and zinc across most age groups.
Conclusions: Dietary intakes of US infants are largely nutritionally adequate; concern exists over iron intakes in those aged 6–11.9 mo. For toddlers and preschoolers, high intake of sodium and low intakes of potassium, fiber, and vitamin D and, for preschoolers, excess saturated fat are of concern. Excess retinol, zinc, and folic acid was noted across most ages, especially among supplement users. J Nutr 2018;148:1557S–1566S.
Introduction
From 1992 to 2002, the National Nutrition Monitoring and Related Research Act of 1990 was instrumental in establishing an extensive framework to provide current information about the dietary exposures and nutritional status of US citi- zens (1). National nutrition surveys, such as the former Continuing Survey of Food Intake by Individuals and NHANES, have been used since the 1980s to inform policy and program decisions and to provide a valuable resource for research applications. Although these resources have advanced our understanding of childhood and adult nutritional status considerably, less and young children that included breastfed infants and intake from dietary supplements. The 2016 FITS data come at an ideal time in the nutrition policy landscape, since the 2014 Farm Bill mandates inclusion of the so-called “B-24” age group (i.e., birth to 24 mo) in the 2020–2025 Dietary Guidelines for Americans for the first time since the Guidelines were first issued >35 y ago (6). Given the very specific nutritional needs of the B-24 age group to support rapid growth and development, understand- ing current trends in dietary intakes is critical to inform such policy and best tailor dietary advice for infants and children. The purpose of this study was to estimate total usual dietary in- takes for energy and most nutrients among infants and children <4 y old, incorporating nutrient exposures from all sources in the FITS 2016.
Methods
FITS survey methods. Full details of the FITS 2016 survey selection and procedures are described elsewhere (7). Briefly, this was a nationwide, cross-sectional survey. Households were selected from 4 sampling frames. Precision requirements for subgroup analysis were achieved by partitioning the eligible population into 24 strata based on 12 age groups and participation in the Special Supplemental Nutrition Program for Women, Infants and Children (WIC). Random sampling was applied with each stratum. Sampling weights were calculated to account for the probability of household selection and then adjusted for nonresponse and incomplete coverage by calibration to reflect the US population aged birth to 47.9 mo. For this analysis, the 12 age groups were categorized as follows: younger infants (birth to 5.9 mo), older infants (6–11.9 mo), toddlers (12–23.9 mo), younger preschoolers (24–36.9 mo), and older preschoolers (36–47.9 mo). Detailed demo- graphic information can be found in Supplemental Table 1.
Dietary intake data were collected from parents or caregivers by trained interviewers based on multiple-pass 24-h dietary recall and the Nutrition Data System for Research (NDSR, version 2015: University of Minnesota, Minneapolis, MN). Breast milk that was directly fed to a child was not quantified during the dietary recall. Direct breastfeeding volumes are difficult to obtain; volumes were assigned according to coding rules established for FITS 2008 (8) and based upon the extensive work of Dewey et al. and Kent et al. (9–11). The estimated breastmilk volume strategy used by FITS has been further supported in systematic review and model estimates by Da Costa et al. (12) based on stable isotope methods from 12 countries on 5 continents. The FITS methods are the standard for breast-milk assessment in the United States and are also used by the CDC (3) to estimate direct breastfeeding volumes. However, if the participant indicated that she had expressed milk, then the amount was quantified and coded as such.
A total of 3235 children <4 y old were included in the survey. A second 24-h recall was collected from 799 children to estimate within- person variance for estimating usual nutrient intakes. The study protocol and instruments were approved by the institutional review boards of RTI International, the University of Minnesota, and the Docking Institute of Public Affairs, Fort Hays State University, who also assisted with data collection in the recruitment phase.
Statistical analysis. All statistical analyses were performed with the use of SAS (version 9, SAS Institute Inc.) and SAS-callable SUDAAN® (version 11, RTI International) software. Before the diet can be characterized as at-risk for inadequacy or excess relative to Dietary Reference Intakes (DRIs), usual or long-term estimates are needed that are adjusted for random measurement error (i.e., day-to-day variation) in self-reported diet (13–15). Several statistical methods are available to adjust the 24-h recall data to remove within-person variation (i.e., ran- dom error) to better estimate usual dietary intakes (16–20). All of these methods have a similar underlying framework that a single day of intake is not representative of usual or habitual intakes and seek to remove the random error to the extent possible, and require 2 repeat measurements for a representative subsample of the population group of interest to allow computation of both variance components (4). For this this analysis, macros developed to implement the National Cancer Institute method (19, 20) were used to produce the mean and standard error for a given usual intake, as well as the percentiles of intake and the probabilities of meeting the Estimated Average Requirement (EAR,% <EAR) and exceeding the Adequate Intake (AI, % >AI) or Tolerable Upper Intake Level (UL, % >UL), with the use of the probability approach. For many nutrients, only an AI is available. Macronutrients were compared with the Acceptable Macronutrient Distribution Range (AMDR) for children 12 mo. The statistical model fit with this procedure incorporated the sampling weights and covariate adjustment for day of the week of the dietary recall (weekend/weekday), and interview sequence (first or second dietary recall). Usual intake models were based on nutrient intakes from food sources and then adjusted to ac- count for nutrient intakes from dietary supplements as recommended (21). The dietary data are total intakes, shown for supplement users and nonusers combined. Dietary data without the inclusion of dietary supplement overestimates the prevalence of inadequacy (i.e., % <EAR) and underestimates the prevalence of potentially excessive intakes (i.e.,>UL) (22–24). Estimates of nutrient intakes from foods alone by age group can be found in the Supplemental Tables 2–6 and stratified by WIC participation in Jun et al. (25) in this supplement.
Results
Feeding type. The proportion of US infants fed formula is higher than that of those exclusively fed breast-milk in both infant age groups (Supplemental Table 1). Over 70% of all infants were “ever breastfed” across all age groups. By the age of 12 mo most children are not consuming breast-milk or formula.
Dietary supplement use. Dietary supplement use varies by age group, with the highest use occurring in children aged 36–47.9 mo (Table 1). Across all groups, most children (>95%) are taking only one supplement product (data not shown). Among infants and children taking supplements, supplements contribute substantially towards nutrient exposures. Across all age groups, vitamin D was the most prevalent nutrient used as a dietary supplement, with a mean intake from supplements alone hovering at the AI (for children aged <12 mo) or the EAR (for children aged 12 mo) mark of 10 μg/d for users of dietary supplements.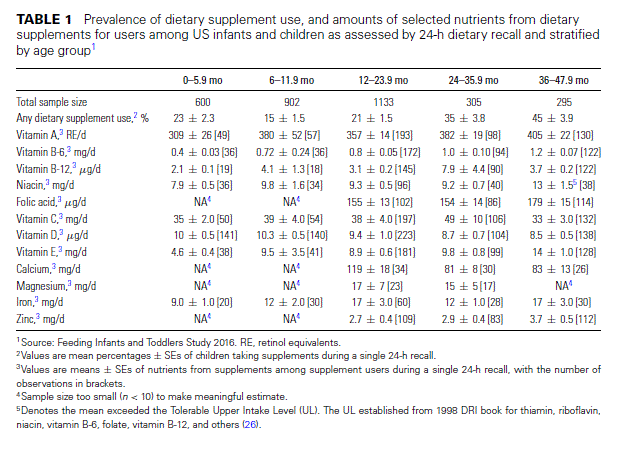
Infants (birth to 12 mo). Mean energy intakes among younger infants (i.e., those aged 0–5.9 mo) are 660 kcal/d, with about half coming from dietary fat (Table 2). For all nutrients, very high proportions of young infants exceed the AI, with vitamins D and E the only exceptions. Although the number of children taking vitamin E supplements in this age group is quite small (n 38 out of 600), the average intakes from supplements among users exceeded the AI for it. Approximately 40% of young infants exceed the UL for retinol and zinc.
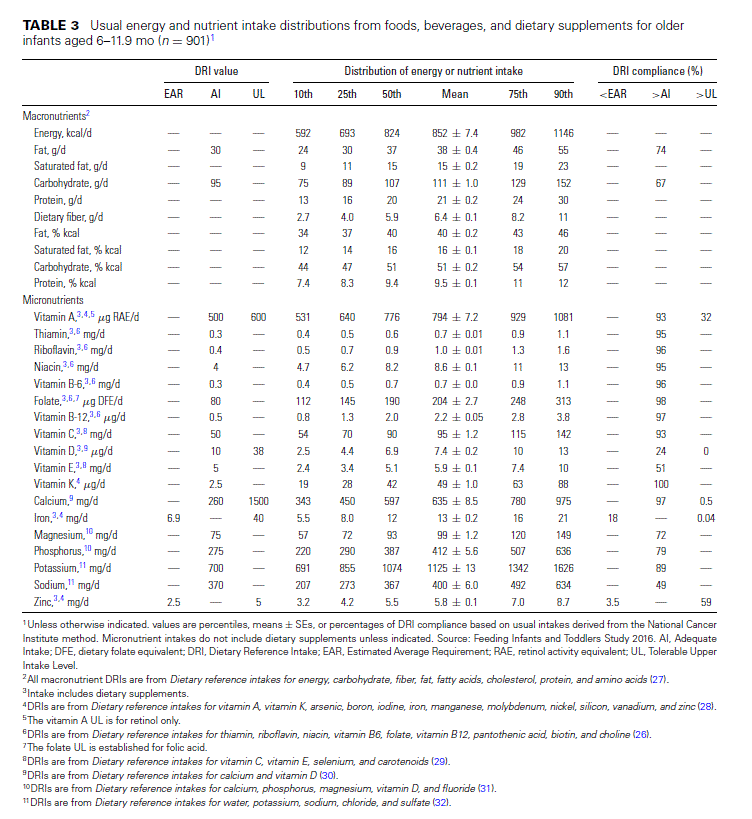
For older infants (aged 6–11.9 mo), there is an established EAR for iron and zinc. About 20% of older infants are at risk for iron inadequacy, whereas <5% are at risk for zinc inadequacy (Table 3). However, large proportions of infants exceed the UL for zinc, and because there is virtually no use of supplements containing zinc in this age group (Table 1), the excess is com- ing exclusively from foods and beverages. In contrast, although about one-third of older infants exceed the UL for retinol, the sources are both diet and dietary supplements, with the average supplement dose providing about half the UL among users in this age group.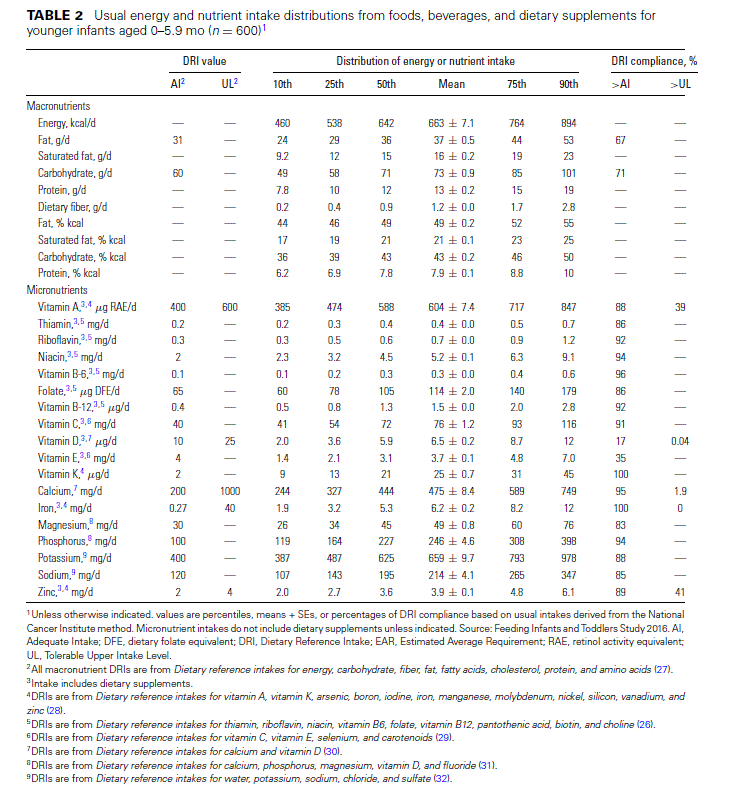
Toddlers (12–23.9 mo). Mean energy intakes for toddlers (12–23.9 mo) are 1170 kcal/d (Table 4). The percentage of energy contributed by fat is less than the AMDR for 30% of toddlers, whereas very few exceed the AMDR. Most toddlers have carbohydrate energy (87%) and protein energy (92%) within the AMDRs, respectively. More than half of toddlers have intakes of vitamin D and vitamin E that put them at risk of inadequacy as assessed by comparison to the EAR. In contrast, there is a very low prevalence of inadequacy (<3%) for vitamin A, all B vitamins, vitamin C, magnesium, and phosphorus, and only slightly higher estimates of inadequacy for calcium (9%) and iron (7%). Although the prevalence of exceeding the AI for fiber and potassium is also very low, many toddlers exceed the UL for sodium (39%), retinol (26%), and zinc (43%).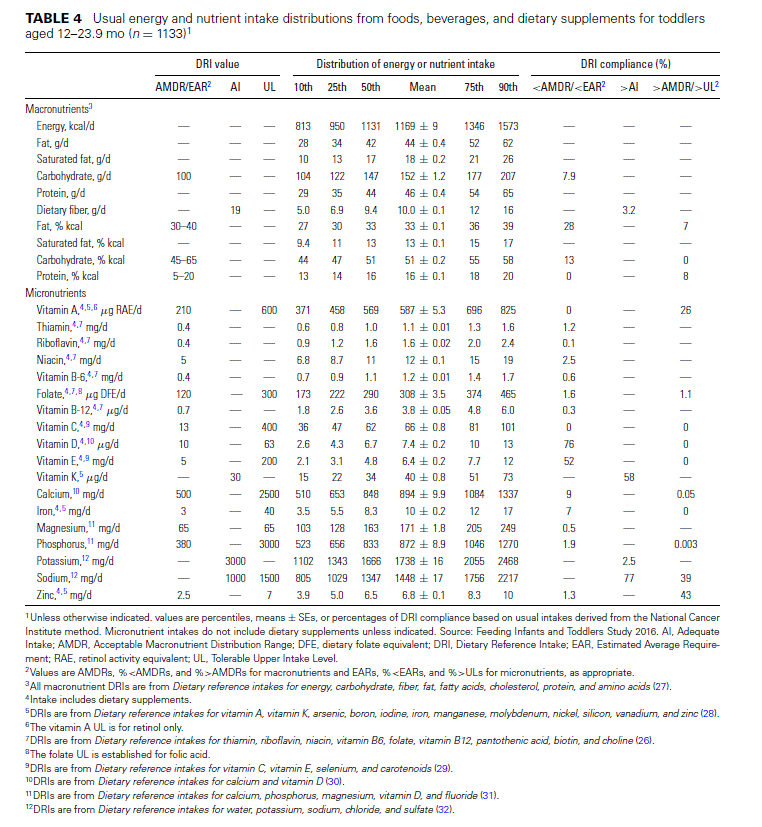
Preschoolers (24–47.9 mo). Mean energy intake for younger preschoolers (24–35.9 mo) is 1379 kcal (Table 5). Although almost all younger preschoolers had energy intakes within the AMDRs from carbohydrate (92%) and protein (94%), more than one-third had total energy from fat less than the AMDR (39%), but also exceeded the percentage of energy contribution recommendations for saturated fat (68%). A considerable proportion of younger preschoolers have at-risk intakes of vitamin D (80%), even with the use of dietary supplements. The prevalence of at-risk intakes is very low (<2%) for all B-vitamins, vitamin C, magnesium, and phosphorus, and it is only slightly higher for vitamin A (4%), calcium (6%), and iron (4%). The prevalence of exceeding the AI is very low for fiber (9%) and potassium (6%). However, almost two-thirds of younger preschoolers exceed the AI for vitamin K, and many exceed the UL for sodium (70%), retinol (46%), zinc (56%), and folic acid ( 6%).
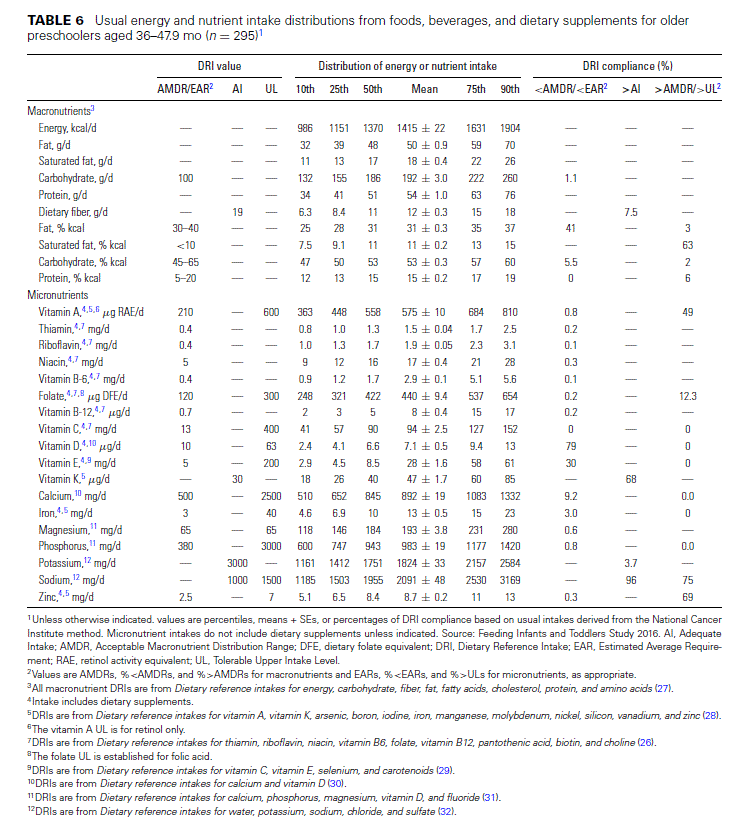
Mean energy intake for older preschoolers (36–47.9 mo) was 1415 kcal (Table 6). Very similar themes for energy in-takes from macronutrients and nutrient intakes emerge for 3-y-old children as were evident in younger preschoolers (Table 5). About 40% of older preschoolers have low energy intakes from total fats paired with high energy intakes from saturated fats. Most do not meet the vitamin D recommendations and about one-third do not meet the vitamin E recommendations. Similarly, their intakes of fiber and potassium are low compared with recommendations, although their intakes of most other nutrients were largely adequate. Older preschoolers continue to consume excessive amounts of retinol (49%), folic acid (12%), sodium (75%), and zinc (69%).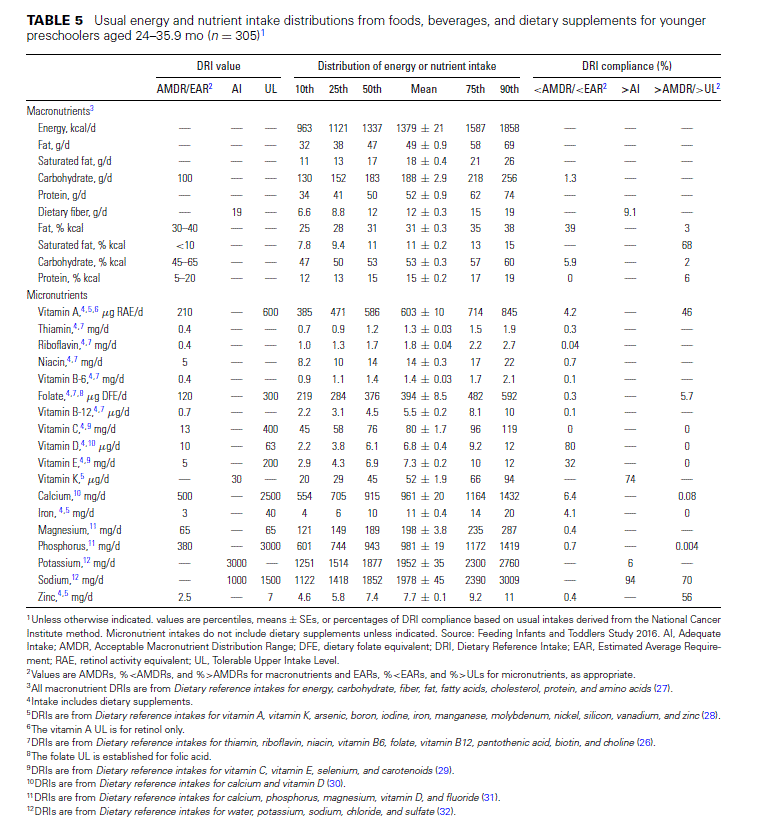
Discussion
In FITS 2016, some consistent themes emerged that were also apparent in earlier iterations of the FITS (33, 34) as well as recent NHANES data (3). Total usual intakes of infants were by and large nutritionally adequate, but once family or table foods start to predominate the diet at 12 mo of age (35), suboptimal intake of some nutrients appeared. This was particularly no-table for high-sodium and low-potassium intakes (33, 34).
Current recommendations suggest that intakes of potassium should be higher than those of sodium, and yet the reverse is apparent among these children starting at 12 mo of age (32). Across all age groups, excessive intakes of vitamin A (retinol), zinc, and folic acid (in some age groups) were also evident, often paired with low intakes of fiber, vitamin D, and vitamin E. Low intakes of iron and calcium were also of concern, but only in some age groups (33, 34).
At 12 mo of age, the percentage of total energy intake contributed from dietary fat decreased and the percentage of contribution from protein increased and remained relatively constant until 48 mo of age, which was congruous with American Academy of Pediatrics recommendations (36). However, substantial proportions of toddlers and children aged 2–3 y were below the AMDR for total fat. Based on the high proportion of children exceeding the energy requirement for saturated fat, the types of fats consumed by children aged >12 mo are not the optimal ones, potentially putting them at risk for suboptimal intakes of essential fatty acids.
The FITS data represent usual intake exposures that are adjusted for measurement error to the extent possible. This is the first report of usual total nutrient intakes in the 0-to 5.9-mo age group; FITS 2008 was only able to estimate 1-d means (33). Usual intake means that single-day estimates of intake are adjusted for random measurement error; this adjustment is particularly important when looking at the tails of the distributions, or the prevalence of individuals at risk for inadequacy or excess (4). We also present total usual intakes, inclusive of dietary supplements; these estimates are particularly salient because of the high proportion of supplement use within certain age groups among infants, toddlers, and children aged 2–3 y. Previous FITS studies have shown dietary intakes for users and nonusers combined (33, 34) and separated (37). In FITS 2016, we presented dietary supplement users combined with nonusers to permit estimation of national prevalence trends for inadequacy and excess. However, data presented this way tend to underestimate nutritional exposures for supplement users and overestimate nutritional exposures for nonusers (22–24). Most of the dietary supplements used in this age group do not contain fiber, sodium, macronutrients, or potassium. In infants, most supplement use was confined to vitamin D, usually in droplet form (data not shown).
Once children can chew and swallow, multiple nutrient supplements (i.e., gummies and multivitamins) start to contribute more towards nutrient exposures for many nutrients. Nonetheless, the nutrient estimates from foods alone (Supplemental data), do not substantially differ from total intakes (inclusive of supplements) with the exception of vitamins D and E in terms of meeting the AI and the EAR for all age groups. The prevalence of exceeding the UL increased substantially when dietary supplements are considered for vitamin A ( 12 mo of age) and for zinc ( 36 mo of age). Given that there is very little nutrient inadequacy of vitamin A and zinc in these age groups, dietary supplements are not necessarily essential for meeting recommendations and manufacturers could potentially reformulate the amount of these nutrients provided in their products.
Our data suggest that among children aged 12 mo it is difficult to obtain the recommended vitamin D intakes without the use of supplements. FITS 2016 data presented elsewhere in this supplement also suggest that children <4 y old who are participating in WIC have more optimal vitamin D intakes than those who are not (25). It should be noted that estimates of vitamin D inadequacy from the diet are often higher than that of estimates from serum 25 (OH) vitamin D (which includes the contribution of sunlight exposure), but little is known about the relation between dietary intakes and biomarkers of vitamin D exposure in infants (38).
A new finding from the FITS 2016 data is that the use of dietary supplements has increased among infants and toddlers, with a substantial change the 0- to 5.9-mo age group from 9% reported in FITS 2008 to 23% in FITS 2016 (37). This increased use (predominantly from the use of vitamin D–containing supplements) dovetails nicely with the increase in exclusive breastfeeding rates and concomitant American Academy of Pediatrics recommendations for the use of vitamin D supplements in infants.
We observed a higher prevalence of iron inadequacy among older infants (18%), which parallels the finding that infant cereal consumption has decreased in this age group and infant meats are not consumed by many (39). The prevalence of iron inadequacy reported here is also higher than was estimated for infants in NHANES 2009–2012 (10% <EAR), which did not account for dietary supplement use as we did in this study (3). Moreover, the prevalence of iron inadequacy was higher in FITS 2016 than in FITS 2008 and 2002 for all children aged 12 mo (33).
The majority of the available DRIs were set between 1997 and 2005, and only 2 nutrient DRIs have been updated since then: calcium and vitamin D in 2011 (30). Little experimental research is available on nutrient requirements of infants and very young children. Across all age groups, and especially <12 mo of age, the availability of EARs is limited for appropriately evaluating intakes for adequacy, especially for infants <12 mo for whom there are only AIs. AIs are derived from published intake distributions or estimated mean intake supplied by human milk for healthy, exclusively breastfed infants (with the exception of vitamin D) (4). An AI is assumed to exceed the RDA for a nutrient, if one could be established. Thus, in applying the AI, the proportion of a group that exceeds the AI should reflect those who have adequate intakes, but there is no scientific basis to state that the proportion of intakes lower than the AI is an estimate of the prevalence of inadequacy. Exceeding the AI essentially means that the average intakes of infants from birth to 12 mo is quite high. Since most dietary supplements in this age group are confined to vitamin D, nutrients are obtained through foods and beverages (i.e., formula, breast-milk, and juice). Less than two-thirds to half of infants and children were meeting the recommendations for intakes of vitamin E. The ULs for young infants and children have been criticized as having been established with too little available data and are considered to be too low for many nutrients (40). Indeed, for zinc, 40% of US infants and children exceed the UL from diet alone. Although total vitamin A intakes exceeded the UL in a large proportion of infants and toddlers, it should also be noted that substantial numbers exceeded the UL for vitamin A from foods alone.
Thus, the ULs for vitamin A and zinc should be considered for re-evaluation, since so many children exceed them, whereas the EAR for vitamin E deserves review since so many children fail to meet it without any documented adverse health effects. The formulations of dietary supplements targeted to infants and children need to be optimized both to more closely match their nutritional needs, and to reduce the risk of excessive exposures based on the current ULs.
The strengths of this study include new population-based data on total usual nutrient intakes from foods and dietary supplements among children aged <4 y, with emphasis on very young infants and toddlers. The major limitation of this cross-sectional survey is that diet was measured by self-report from parents and caregivers. FITS and other large studies are useful for examining cross-sectional trends in dietary intakes over time to develop hypotheses on total intakes and specific foods and beverages that may increase risks of pediatric overweight and obesity. However, studies that collect longitudinal data, especially with the inclusion of biomarker and anthropometric measurements, are also needed to fill these gaps and to best in- form research, clinical practice, and policy.
In conclusion, dietary intakes of US infants (<12 mo of age) are largely adequate, exceeding the AIs for all nutrients except vitamins D and E, but the likelihood of inadequacy increases in toddlers and preschoolers. Iron remains a nutrient of concern in older infants, with almost 1 in 5 below the EAR. Many of the nutrients of concern identified in the existing Dietary Guidelines for Americans, including low fiber, vitamin D, and potassium in- takes and high sodium intakes, were also observed in this data for children aged >12 mo. Additional nutrients of concern at all ages in this analysis are excessive retinol and zinc (and to a lesser extent folic acid) intakes, especially among children taking dietary supplements that contain these nutrients. Children of all ages in FITS 2016 had satisfactory intakes of B-vitamins, vitamins C and K, and most minerals except those that were previously noted. Concern for the balance of the types of fats consumed by children aged >12 mo is warranted, with concomitant low overall energy intakes from total fat and high percentages of energy intakes from saturated fat.
Acknowledgments
The study upon which the data presented here are based was a collaborative effort of many organizations and individuals; those are listed in the acknowledgements to the companion Methods and Study Design paper (7). In addition, we thank Virginia A Stallings (Children’s Hospital of Philadelphia) for her guidance on current issues in evaluating nutrient status and Anne C Lutes (RTI International) for editorial assistance. The authors’ contributions were as follows—ASA, DJC, EFJ, and ALE: designed the research; DJC: performed all the statistical analysis; RLB, SJ, EFJ, JTD, and ALE: interpreted data; RJB, SJ, JTD, and ALE: wrote the paper; RLB: had primary responsibility for final content of the manuscript; DJC: had primary responsibility for the accuracy of the data; and all authors: read and approved the final manuscript.
References
- Heimbach J. Using the national nutrition monitoring system to profile dietary supplement use. J Nutr 2001;131:1335S–8S.
- Devaney B, Kalb L, Briefel R, Zavitsky-Novak T, Clusen N, Ziegler P. Feeding infants and toddlers study: overview of the study design. J Am Diet Assoc 2004;104:8–13.
- Ahluwalia N, Herrick K, Rossen L, Rhodes D, Kit B, Moshfegh A, Dodd K. Usual nutrient intakes of US infants and toddlers generally meet or exceed Dietary Reference Intakes: findings from NHANES 2009–2012. Am J Clin Nutr 2016;104:1167–74. https://www.ncbi. nlm.nih.gov/pubmed/27629049
- Bailey R, Weaver C, Murphy S. Using the Dietary Reference Intakes to assess intakes. In: Van Horn L, editor. Research: successful approaches. Chicago: Academy of Nutrition and Dietetics; 2018.
- Briefel RR, Kalb LM, Condon E, Deming DM, Clusen NA, Fox MK, Harnack L, Gemmill E, Stevens M, Reidy KC. The FeedingInfantsand Toddlers Study 2008: study design and methods. J Am Diet Assoc 2010;110:S16–26.
- Raiten D, Raghavan R, Porter A, Obbagy J, Spahn J. Executive summary: Evaluating the evidence base to support the inclusion of infants and children from birth to 24 mo of age in the Dietary Guidelines for Americans—“the B-24 Project”. Am J Clin Nutr 2014;99:S663–91.
- Anater AS, Catellier DJ, Levine BA, Krotki KP, Jacquier EF, Eldridge AL, Bronstein KE, Harnack LJ, Peasley JM, Lutes AC. The Feeding Infants and Toddlers Study (FITS) 2016: study design and methods. J Nutr 2018;148:1516S–24S.
- Ponza M, Devaney B, Ziegler P, Reidy K, Squatrito C. Nutrient intakes and food choices of infants and toddlers participating in WIC. J Am DietAssoc 2004;104:71–79.
- Dewey K, Finlay D, Lonnerdal B. Breast milk volume and composition during late lactation (7-20 months). J Pediatr Gastroenterol Nutr 1984;3:713–20.
- Dewey K, Lonnerdal B. Milk and nutrient intake of breast-fed infants from 1 to 6 months: relation to growth and fatness. J Pediatr GastroenterolNutr 1983;2:497–506.
- Kent K. Breast volume and milk production during extended lactation inwomen. ExpPhysiol 1999;84:435–47.
- da Costa TH, Haisma H,WellsJC,ManderAP,WhiteheadRG, Bluck LJ. How much human milk do infants consume? Data from12 countries using a standardized stable isotope methodology. J Nutr 2010;140:2227–32.
- Beaton G, Milner J, Corey P, McGuire V, Cousins M, Stewart E, de Ramos M, Hewitt D, Grambsch P, Kassim N et al. Sources of variance in 24-hour dietary recall data: implications for nutrition study design and interpretation. Am J Clin Nutr 1979;32:2546–59.
- Beaton G, Milner J, McGuire V, Feather T, Little J. Source of variance in 24-hour dietary recall data: implications for nutrition study design and interpretation. Carbohydrate sources, vitamins, and minerals. Am J Clin Nutr 1983;37:986–95.
- Kipnis V, Midthune D, Freedman L, Bingham S, Day N, Riboli E, Ferrari P, Carroll R. Bias in dietary-report instruments and its implications for nutritional epidemiology. PublicHealthNutr 2002;5:915–23.
- National Research Council. Nutrient adequacy. Washington (DC): National Academy Press; 1986.
- Nusser S, Carriquiry A, Dodd K, Fuller W. A semiparametric transformation approach to estimating usual daily intake distributions. J Am Stat Assoc 1996;91:1440–9.
- Subar A, Dodd K, Guenther P, Kipnis V, Midthune D, McDowell M, Tooze J, Freedman L, Krebs-Smith S. The food propensity questionnaire: concept, development, and validation for use as a covariate in a model to estimate usual food intake. J Am Diet Assoc 2006;106: 1556–63.
- Tooze J, Midthune D, Dodd K, Freedman L, Krebs-Smith S, Subar A, Guenther P, Carroll R, Kipnis V. A new statistical method for estimating the usual intake of episodically consumed foods with application to their distribution. J Am Diet Assoc 2006;106:1575–87.
- Dodd K, Guenther P, Freedman L, Subar A, Kipnis V, Midthune D, Tooze J, Krebs-Smith S. Statistical methods for estimating usual intake of nutrients and foods: a review of the theory. J Am Diet Assoc 2006;106:1640–50.
- Garriguet D. Combining nutrient intake from food/beverages and vitamin/mineral supplements. Health Rep 2010;2010:71–84.
- Bailey RL, Fulgoni FL III, Keast D, Dwyer JT. Dietary supplement use is associated with higher intakes of minerals from food sources. Am J Clin Nutr 2011;94:1376–81.
- Bailey RL, Fulgoni FL III, Keast D, Dwyer JT. Examination of vitamin intakes among US adults by dietary supplement use. J Acad Nutr Diet 2012;112:657–63 e4.
- Bailey RL, Fulgoni FL III,KeastD,LentinoC,DwyerJT.Dodietary supplements improve micronutrient sufficiency in children and adolescents? J Pediatr 2012;161:837–42.
- Jun S, Catellier DJ, Eldridge AL, Dwyer JT, Eicher-Miller HA, Bailey RL. Usual nutrient intakes from the diets of US children by WIC participation and income: findings from the Feeding Infants and Toddlers Study (FITS) 2016. J Nutr 2018;148:1567S–74S.
- Institute of Medicine (Food and Nutrition Board). Dietary reference intakes for thiamin, riboflavin, niacin,vitamin B6,folate,vitamin B12, pantothenic acid, biotin, and choline. Washington (DC): National Academies Press; 1998.
- Institute of Medicine (Food and Nutrition Board). Dietary reference intakes for energy, carbohydrate, fiber, fat, fatty acids, cholesterol, protein, and amino acids. Washington (DC): National Academies Press; 2005.
- Institute of Medicine (Food and Nutrition Board). Dietary reference in takes for vitamin A,vitamin K,arsenic,boron,iodine, iron, manganese, molybdenum, nickel, silicon, vanadium, and zinc. Washington (DC): National Academies Press; 2001.
- Institute of Medicine (Food and Nutrition Board). Dietary reference intakes for vitamin C, vitamin E, selenium, and carotenoids. Washington (DC): National Academies Press; 2000.
- Institute of Medicine (Food and Nutrition Board). Dietary reference intakes for calcium and vitamin D. Washington (DC): National Academies Press; 2011.
- Institute of Medicine (Food and Nutrition Board).Dietary reference intakes for calcium, phosphorus, magnesium, vitamin D, an fluoride. Washington(DC): National Academies Press; 1997.
- Institute of Medicine (Food and Nutrition Board). Dietary reference intakes for water, potassium, sodium, chloride, and sulfate. Washington (DC): National Academies Press; 2005.
- Butte NF, Fox MK, Briefel RR, Siega-Riz AM,DwyerJT,DemingDM, Reidy KC. Nutrient intakes of US infants, toddlers, and preschoolers meet or exceed Dietary Reference Intakes. J Am Diet Assoc 2010;110:S27–37.
- Devaney B, Ziegler P, Pac S, Karwe V, Barr SI. Nutrient intakes of infants and toddlers. J Am Diet Assoc 2004;104:14–21.
- Birch LL, Doub AE. Learning to eat: birth to age 2 y. Am J Clin Nutr 2014;99:723S–8S.
- American Academy of Pediatrics (Committee on Nutrition). Complementary feeding. In: Kleinman R, editor. Pediatric Nutrition Handbook. Elk Grove Village (IL): American Academy of Pediatrics; 2009.
- Briefel R, Hanson C, Fox MK, Novak T, Ziegler P. Feeding Infants and Toddlers Study: do vitamin and mineral supplements contribute to nutrient adequacy or excess among US infants and toddlers? J Acad NutrDiet 2006;106:52.e1–52.e15.
- Schleicher R, Sternberg M, Lacher D, Sempos C, Looker A, Durazo- Arvizu R, Yetley E, Chaudhary-Webb M, MawK,PfeifferCetal. The vitamin D status of the US population from 1988 to 2010 using standardized serum concentrations of 25-hydroxyvitamin D shows recent modest increases. AmJClinNutr2016;104:454–61.
- Dietz W. The food intake patterns of infant and toddlers in the USA in 2016. In J. T. Dwyer and V. A. Stallings (Chairs), Informing B-24 Dietary Guidelines: Findings from the New Feeding Infants and Toddlers Study 2016. Scientific session of the American Society of Nutrition at the Experimental Biology 2017 Conference, Chicago, IL. Available from https://asnsscientificsessionsatexp2017.sched.com/event/9jiq/informing- b-24-dietary-guidelines-findings-from-the-new-feeding-infants-and- toddlers-study-2016.
- Zlotkin S. A critical assessment of the upper intake levels for infants and children. JNutr2006;136: 502S–6S.
If you liked this post you may also like


