Food sources of energy and nutrients in infants, toddlers and young children from the Mexican National Health and Nutrition Survey 2012.
Abstract
Food sources of nutrients in Mexican children are not well known. To fill the knowledge
gap, dietary intake was assessed in 2057 children using a 24-h dietary recall. All reported foods and beverages were assigned to one of 76 food groups. Percent contribution of each food group to nutrient intake was estimated for four age groups: 0–5.9, 6–11.9, 12–23.9, and 24–47.9 months. Breast milk, infant formula, and cow’s milk were the top sources of energy and nutrients, especially in younger groups. Among infants aged 6–11.9 months, the top food sources of energy included soups and stews, cookies, fruit, tortillas, eggs and egg dishes, and traditional beverages. The same foods
plus sweetened breads, dried beans, and sandwiches and tortas were consumed as the top sources of energy among toddlers and young children. Milk, soups, and stews were the top contributors for all nutrients and tortillas, eggs, and egg dishes were among the top contributors for iron and zinc.
This study showed that low nutrient-dense cookies, sweetened breads, and traditional beverages were among the core foods consumed early in life in Mexico. This compromises the intake of more nutritious foods such as vegetables and fortified cereals and increases the risk of obesity.
Keywords
ENSANUT 2012; infants; toddlers; young children; food sources; energy; nutrients
1. Introduction
Proper nutrition throughout infancy and early childhood is not only vital for optimal growth and development but also helps to lay the foundation for a child’s future health [1,2]. The diet in infancy and early childhood is marked by high nutrient needs [3], a transition from an all-milk diet to family foods in the first year of life [4], and the development of food preferences that may affect long-term food choices later in life [5].
The quality of a child’s nutrition is shaped by decisions made by parents and caregivers as well as the social and economic environment. At present, Mexico is facing malnutrition characterized by stunting and micronutrient deficiencies in young children from low-income families, iron deficiency anemia in young children, widespread obesity in all age groups, and a high prevalence of non-communicable chronic diseases [6–10]. As for young children, recent studies from the 2012 Mexican National Health and Nutrition Survey (Encuesta Nacional de Salud y Nutrición; ENSANUT 2012) have
observed shortcomings in infant and child feeding practices [11]. Examples include a low prevalence of breastfeeding, low consumption of iron-rich foods, and high consumption of sugar-sweetened beverages and sweet foods [12,13]. These shortcomings very likely contribute to the imbalanced nutrient intakes reported in recent dietary surveys, including inadequate intakes of iron, calcium, vitamin D, vitamin E, folate, and fiber and excessive intakes of energy, added sugars, saturated fat,
and sodium [14–18]. Quantitative assessment of food sources of energy and nutrients can show what foods are important contributors of nutrients in the population’s diet. This knowledge can assist healthcare professionals to form targeted measures to correct shortcomings. Up to now, detailed quantitative analyses on the dietary sources of nutrients in Mexico have been lacking. One recent study conducted in Mexican children under two years of age reported food sources of energy but not nutrients [12].
To fill the knowledge gap, the aim of this study was to describe and identify the principal sources of energy and nutrients in the diets of infants, toddlers, and young children from the ENSANUT 2012.
780 mL/day minus the amount of infant formula/other milks consumed. For infants aged six to 11 months fed human milk as the sole milk source, the amount of human milk was assumed to be 600 mL/day. For partially breastfed infants, the amount of human milk was computed as 600 mL/day minus the amount of infant formula/other milks consumed. For breastfed young children aged 12 to 17 months, the amount of human milk was computed as 89 mL per feeding occasion. For breastfed young children aged 18 to 23 months, the amount of human milk was computed as 59 mL per feedingoccasion [20,21].
2.3. Analytic Methods
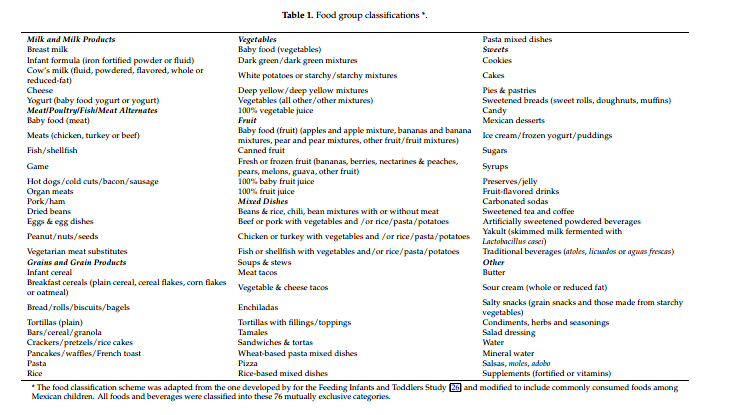
Energy and nutrient intakes were estimated based on the food composition database from the National Institute of Public Health in Mexico (67% foods) [22] and the food composition tables from the United States Department of Agriculture’s Nutrient Database for Dietary Studies (33% of foods). [23]. To calculate added sugars, the intake of each food was linked at the ingredient level (single foods, standardized recipes) or dish level (custom recipes) to the U.S. Department of Agriculture’s NationalNutrient Database for Standard Reference [23] and then further linked to the MyPyramid Equivalents Database [24]. Teaspoon equivalents in the Food Patterns Equivalents Database were converted to grams with the use of the ratio 4.2 g/teaspoon. Vitamin A was estimated in retinol activity equivalents Using the following formula [25]: Retinol activity = g retinol + 1 2 ( g beta-carotene equivalents/6).To investigate food sources of energy and nutrients, a list of 76 food groups was formed based on previous dietary intake studies in young children in the USA (Table 1) [26–28]. Two trained Mexican dietary research specialists and a nutrition scientist at Nestlé adjusted food groups to incorporate local food culture and reflect the relative role of specific types of foods and beverages in the diets of infants, toddlers, and young children living in Mexico [13]. Some common food mixtures were estimated “as consumed”, such as soups, stews, and mixed dishes, and considered a single food item. All foods, beverages, and nutrient supplements were assigned to one of the 76 food groups (Table 1).
2. Materials and Methods
2.1. Study Population
ENSANUT is a cross-sectional, population-based survey that characterizes the health and nutritional status of the Mexican population [19]. The survey used a multi-stage, stratified, and clustered sampling system drawn to represent all states, four geographic regions, and socioeconomic strata in Mexico. The data were collected from 50,528 Mexican households, with a response rate of 87% [19]. A total of 2057 children from birth to four years of age were used in the current analysis. The data are presented for four age groups: infants 0–5.9 months (n = 182), infants 6–11.9 months (n = 229), toddlers 12–23.9 months (n = 538), and young children 24–47.9 months (n = 1108). The survey protocol and data collection instruments were approved by the Ethics Committee of the Mexican National Institute of Public Health (Instituto Nacional de Salud Pública). Written informed consent was obtained from each eligible person 18 years and older or from the parent or caregiver of participants under 18 years.The characteristics of the study population have been described previously [13]. Briefly, the majority of children (70%) lived in urban areas. Of the primary caregivers, most often the mother (85%) had an elementary and/or secondary education; 70% were unemployed and 47% were married.
2.2. Dietary Data Collection
One 24-h dietary recall was collected for each child through a face-to-face interview by trained interviewers with the parent or caregiver. The interviewers asked about all foods and beverages and the amount consumed of each item for the previous 24-h period. Custom recipes or standard recipes developed by the National Institute of Public Health were used to estimate the ingredients in mixed food items. The amount of each food item or ingredient consumed was estimated using common household measurement aids (including spoons, cups, slices, handfuls, etc.) and the information was then converted to grams and milliliters depending on the type of food or beverage consumed.
To improve dietary recall data, the ENSANUT 2012 implemented an automated five-step multiple-pass method and collected data on both weekdays and weekend days [16]. Quality control of the dietary intake data was conducted in two stages, as reported previously by Lopez-Olmedo and colleagues [16]. Briefly, in the first stage, the foods reported by a participant were reviewed and information including coding, quantity reported, recipe ingredients, and the context in which the meal or feeding episode took place was scrutinized. In the second stage, energy and nutrient intakes were reviewed to identify implausible values. The ratio of daily energy intake to estimated energy requirement was calculated for each person and each day and transformed to a logarithmic scale to remove outliers below. 3 SDs and above +3 SDs. Excessive micronutrient intakes were defined as those that exceeded 1.5 times of the 99th percentile of the observed intake distribution of the nutrient in the corresponding sex and age group [16].
Breast milk consumption was estimated based on the child’s age in months and the total amount of other milk (infant formula and cow’s milk) reported over the course of the recall day [20,21]. For exclusively breastfed infants aged birth to 5.9 months, an average intake of 780 mL/day of human was assumed; for partially breastfed infants, the amount of human milk was computed as
2.4. Statistical Analysis
Stata (StataCorp. 2015 Stata Statistical Software: Release 14. College Station, TX, USA: StataCorp LP) was used to create data files, assign individual foods and beverages to food groups, and calculate the contribution of each food group to the overall intake of energy and nutrients. The weighted percentage contribution of each food group for all infants, toddlers, and young children was calculated by adding
the amount of a given nutrient provided by each food group for all individuals and dividing by the total intake of that nutrient consumed by all individuals from all foods and beverages. All estimates incorporated appropriate sample weights to reflect nationally representative results. Only food groups that contributed over 1% of the nutrient intake are presented in this study. Sources of energy and nutrients were assessed separately and are presented for the four age groups mentioned above.
3. Results
Food sources of energy and 14 nutrients in the diets of infants, toddlers, and young children are presented in Table 2 through 16. In each table, the food groups listed present at least 80% of the total energy or nutrient intake.
3.1. Energy, Macronutrients, and Fiber
Different types of milk were the top sources of energy across all age groups but the relative contribution reduced markedly with age. Breast milk, infant formula, and cow’s milk were the first, second, and third sources of energy, collectively contributing 89% of total energy among infants 0–5.9 months (Table 2). These milk sources were still the top three sources of energy among infants 6–11.9 months but the total contribution was lower (53%) as more non-milk foods were consumed. Among toddlers 12–23.9 months, cow’s milk was the first source of energy, infant formula was the third, and breast milk dropped to tenth. Among young children 24–47.9 months, cow’s milk was still
the first source of energy but other milk sources were no longer on the list (Table 2).
Foods and other beverages consumed as the top 10 sources of energy among infants aged 6–11 months included soups and stews, cookies, yogurt, fruit, tortillas, eggs and egg dishes, and traditional beverages (Table 2). Food diversity increased with age, but these top sources of energy for 6–11.9-month-old remained in the top 10 sources of energy among toddlers and young children, except for yogurt (Table 2). Other foods added to the top 10 sources of energy in the two older groups were sweetened breads, which ranked fifth among toddlers and third among young children, dried beans, and sandwiches and tortas (Table 2). Among the top 10 sources of energy, cookies,
sweetened breads, and traditional beverages collectively provided 7%, 14%, and 15% of total energy among 6–11.9-month-old infants, toddlers, and young children, respectively. These foods, together with other foods and beverages high in sugar, including sweetened tea and coffee, fruit-flavored drinks, carbonated sodas, and candy, provided 19% and 22% of daily energy intake among toddlers and young children, respectively.
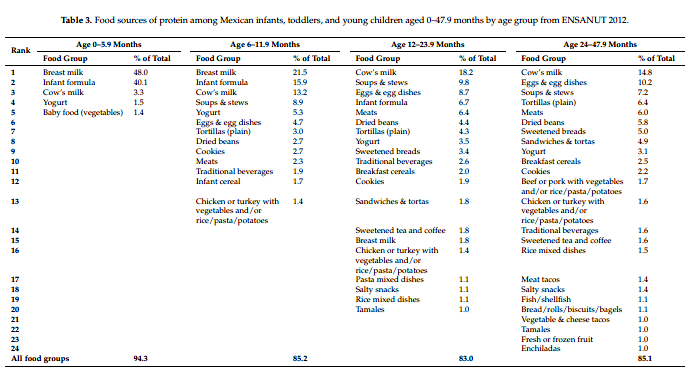
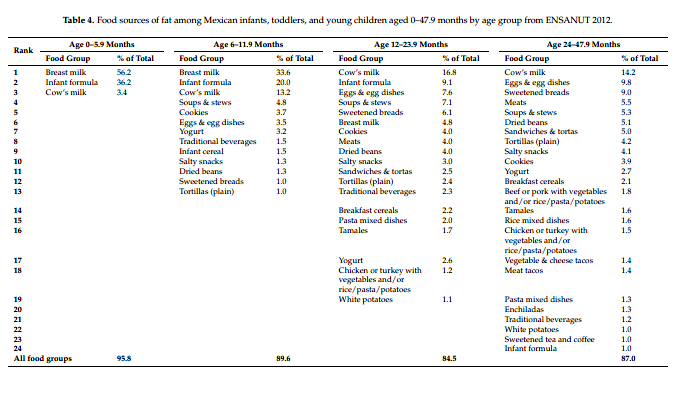
Most of the top 10 milk and food sources of energy were also the top sources of protein and fat (Tables 3 and 4) and saturated fat (Supplementary Table S1) in all age groups. Breast milk, infant formula, and cow’s milk were the top three sources of protein and fat among infants of 0–5.9 months and 6–11.9 months; cow’s milk, soups and stews, and eggs and egg dishes were the top three sources of protein and fat among toddlers and young children (Table 3, Table 4 and Supplementary Table S1). Meats ranked fifth as a source of protein among both toddlers and young children. Tortillas ranked seventh and fourth as sources of protein among toddlers and young children, respectively. Overall,
food sources of total fat and saturated fat were similar, with a slightly varied ranking (Table 4 and Supplementary Table S1).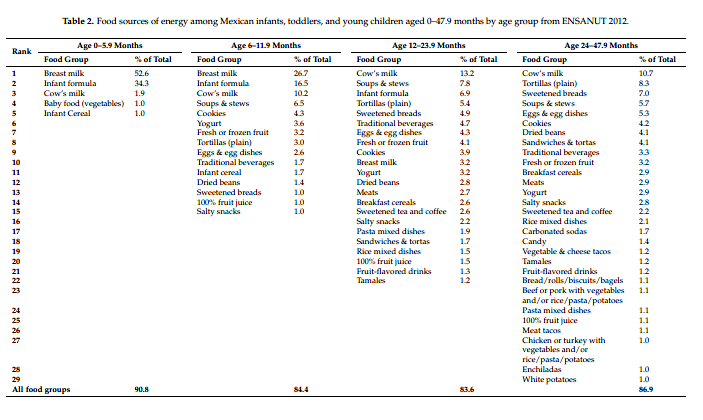
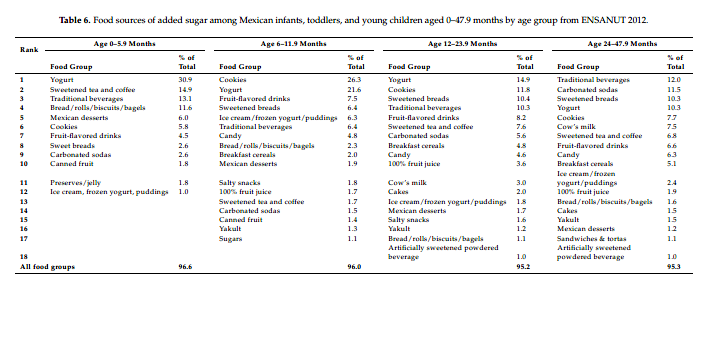
The top contributors to energy were also the top sources of carbohydrate (Table 5). Tortillas ranked as the seventh source of carbohydrate among infants 6–11.9 months, then became the second and first source of carbohydrates among toddlers and young children, respectively. For added sugar, cookies, yogurt, fruit-flavored drinks, sweetened breads, and traditional beverages were the top sources across the age groups from 6–11.9 months onwards (Table 6). The contribution of carbonated sodas to added sugar was higher with increasing age, ranking fourteenth among infants 6–11.9 months, seventh among toddlers, and second among young children. Overall, the ranking of added sugar from traditional beverages was higher than carbonated sodas.
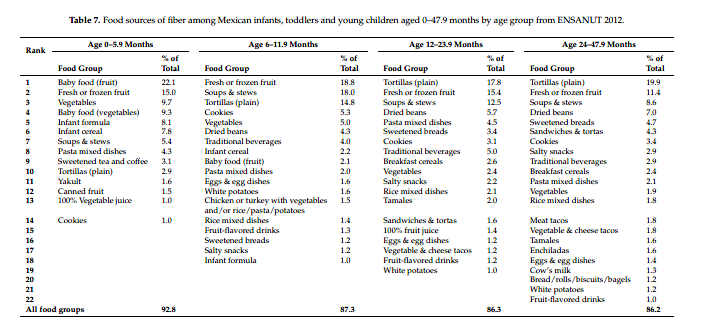
Fruit was the highest ranked source of dietary fiber among infants in both age categories. Among toddlers and young children, tortillas contributed the most fiber, followed by fruit (Table 7). From six months onwards, soups and stews were also an important source of fiber. Other top sources of fiber were vegetables, dried beans, pasta mixed dishes, and sweetened breads.
3.2. Vitamins
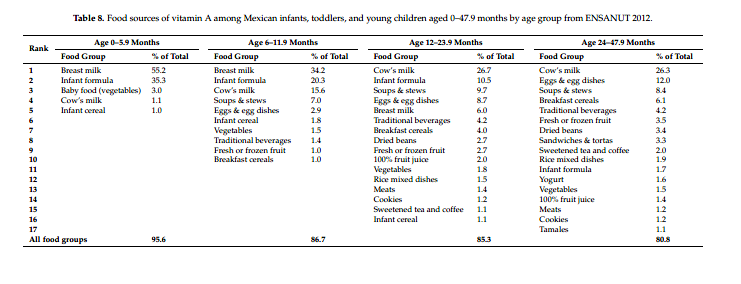
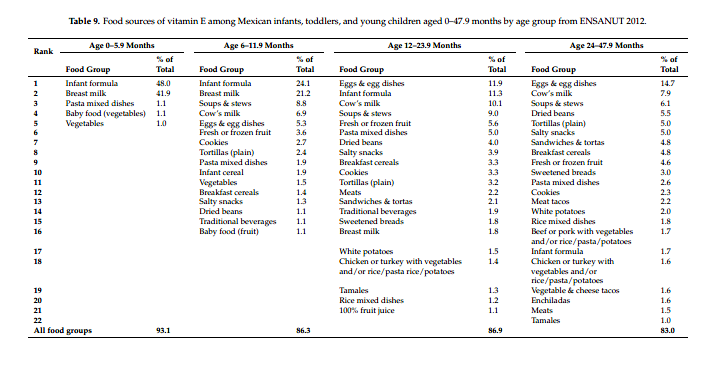
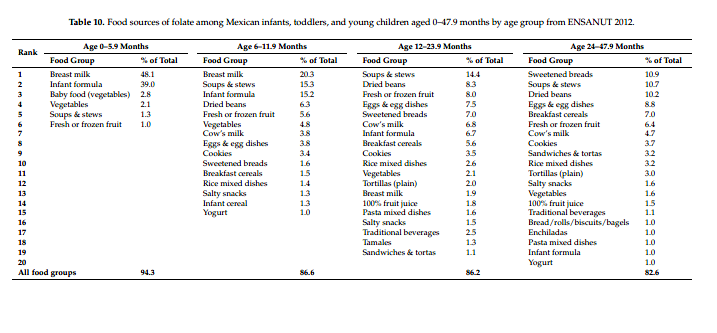
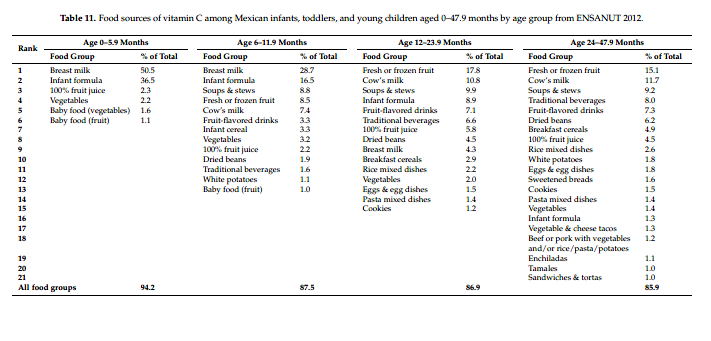
Breast milk, infant formula, cow’s milk, and soups and stews were the main sources of vitamin A (Table 8), vitamin E (Table 9), folate (Table 10), and other B vitamins (Supplementary Tables 2–5), with a slightly varied order. Among toddlers and young children, in addition to different types of milk and soups and stews, eggs and egg dishes, dried beans, tortillas, breakfast cereals, and sweetened breads were also important sources of vitamin A, vitamin E, and B vitamins. Fruit ranked as the first source of vitamin C among toddlers and young children, followed by cow’s milk, soups and stews, infant formula, and traditional beverages (Table 11). For folate, breast milk was the first source among infants; soups and stews were the first and second source among toddlers and young children, respectively, followed by dried beans and eggs and egg dishes (Table 10).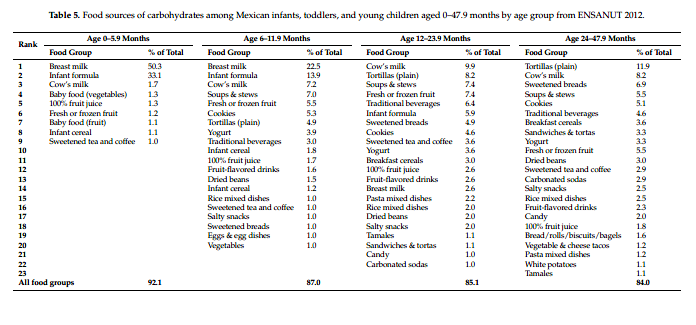
3.3. Minerals and Electrolytes
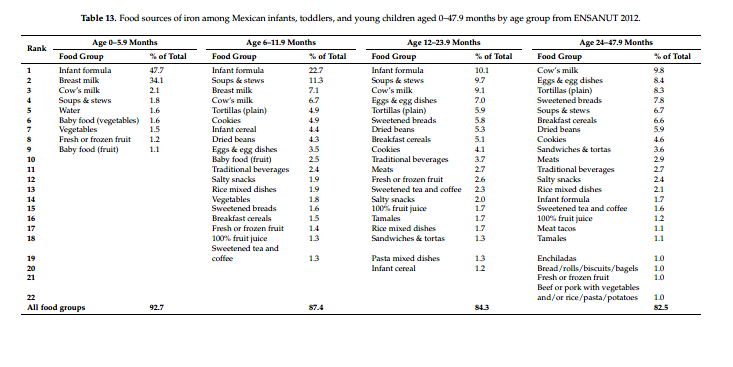
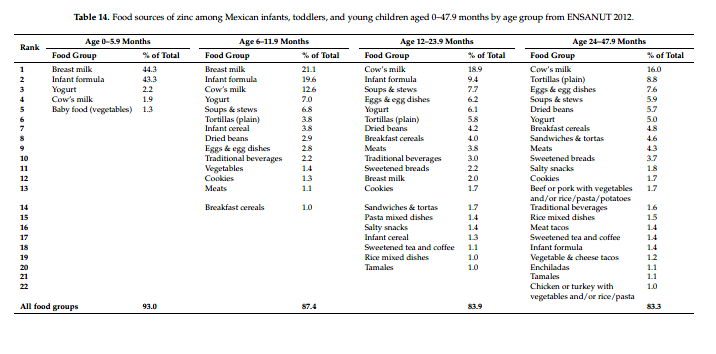
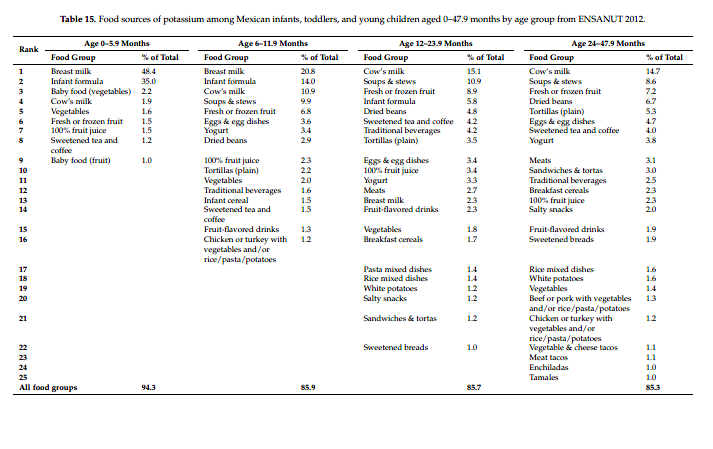
Among infants, in general, breast milk and infant formula were the top two sources of calcium (Table 12), iron (Table 13), zinc (Table 14), and potassium (Table 15). Among toddlers and young children, in addition to cow’s milk, infant formula, yogurt, soups and stews, tortillas, eggs and egg dishes, and dried beans were also important sources of the above minerals. Except for young children, infant formula ranked as the first source of iron among both infants 0–5.9 months and 6–11.9 months and toddlers, followed by breast milk, soups and stews, cow’s milk, and eggs and egg dishes (Table 13). Tortillas ranked fifth as a source of iron among infant 6–11.9 months and toddlers. Cow’s milk was the number one source of iron among young children, followed by eggs and egg dishes, tortillas, and sweetened breads. In addition to different types of milk, yogurt
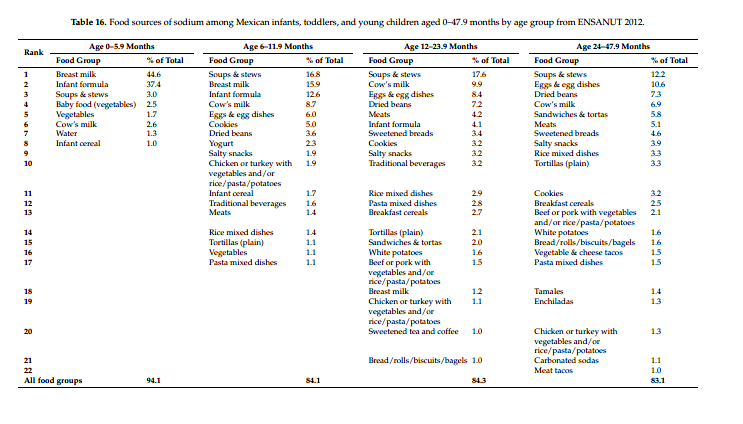
and soups and stews were the top sources of potassium. Fruit was another major source of potassium across all age groups, with the contribution higher with increasing age (Table 15). Soups and stews were the highest contributors of sodium among all age groups except infants 0–5.9 months, followed by cow’s milk, eggs and egg dishes, and dried beans (Table 16).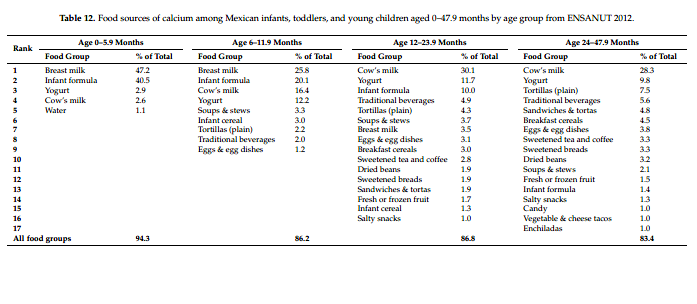
4. Discussion
The results of this study provide a comprehensive picture of food sources of energy and nutrients and show the shifts with age among Mexican children aged 0–47.9 months. Previous studies on nutrient intake in this population reported inadequate intakes of iron, calcium, vitamin D, vitamin E, folate, and fiber and excessive intakes of energy, added sugars, saturated fat, and sodium [14–18]. Our data have provided important insights on those findings.
4.1. Milk Sources
Overall, breast milk, infant formula, and cow’s milk were the top sources of energy, protein, fat, carbohydrates, vitamins (vitamin A, vitamin E, vitamin C, and B vitamins), and minerals (calcium, iron, zinc, and potassium), especially in younger groups. This is similar to what we observed in studies in the USA [26,29] and in China [30]. However, one difference in this study is that cow’s milk was one of the major sources of energy among infants 6–11.9 months. This is a concern because cow’s milk is considered to be an inappropriate milk for children under the age of one year as early feeding of cow’s milk is associated with an increased risk of developing iron-deficiency anemia [31]. The reasons include its low iron content, poor iron availability, and associated occult intestinal blood loss [32].
4.2. Low Nutrient-Dense Foods and Beverages
As infants and toddlers have a small stomach capacity but high nutrient needs to support their rapid growth, complementary foods should be nutrient-dense, i.e., relatively low in calories and high in vitamins and minerals [3]. However, low nutrient-dense and energy-rich cookies, sweetened breads, and traditional beverages were consumed as core foods in the diet of Mexican children. These observations are very much aligned with previous findings that showed a high proportion of energy was provided by caloric beverages [12,33] and that added sugar consumption was high
among Mexican children aged 1–4 years [16,18]. Our study provided further details as to what foods and beverages contributed to the high added sugar consumption and the relative role of each food. In addition, we found that consumption of sweetened foods and beverages started as early as the second six months of life and some food items shifted with increasing age. For example, the contribution of carbonated sodas to added sugar doubled in young children compared to toddlers. It is important that energy-rich foods, which provide little nutritional benefit, are limited [34]. Reduced consumption
of cookies, sweetened breads, sugar sweetened beverages along with lower sugar content of traditional beverages would markedly decrease the total intake of added sugar in Mexican children.
4.3. Food Sources of Iron
Iron-rich foods are lacking in young Mexican children. Iron is of particular importance after six months of age as the infant’s iron stores, which are laid down during gestation, are declining [35]. Thus, complementary foods need to provide iron, either from animal-source foods or from fortification, as recommended in the official Mexican guidelines on nutrition [36] and a recent Mexican complementary feeding consensus paper [37]. Given the detrimental consequences of iron deficiency disorders on cognitive and neurological development [38], a recent position paper on complementary feeding stressed the recommendation of iron-rich food consumption [34]. Previous studies in Mexico have shown that iron intake of infants did not meet recommendations [14], heme-iron intake was low [17], and iron-deficiency anemia was prevalent (23%) [10]. It has already been reported that complementary feeding practices in Mexico lack animal foods [39,40]. In our study, we found that meats provided less than 1% of energy among infants 6–11.9 month olds and were not among the top 10 food sources of energy in toddlers and young children. As a result, meats did not markedly contribute to the intake of iron or vitamins. Also of note, iron-fortified infant cereal made a minimal
contribution to nutrient intake in this population. However, it is important to note that Mexican tortilla flour is fortified with iron [41], which might explain why tortillas appears as the third to fifth sources of iron after 12 months of age. Surprisingly, cow’s milk was found to be a top source of iron (ranked first among young children). This may be caused by two reasons. One is that a proportion of fortified cow’s milk (19.6%) was
grouped into cow’s milk in this study and hence increased the iron contribution from the cow’s milk category. The other reason might be that even though cow’s milk is not high in iron, it is frequently consumed, making it a significant iron source.
4.4. Role of Local Foods
The ranking of a food as a source of energy or a nutrient reflects not only the concentration of a nutrient in a food but also the frequency of consumption of the food. Soups and stews were found to be top contributors to energy and almost all nutrients after milk including total fat, saturated fat, and sodium. Soups and stews are frequently consumed in this population [12,13]. Since soups and stews in Mexico typically contain meat (usually chicken), vegetables, and tortillas, it is understandable that these food mixtures can provide a wide range of nutrients. Tortillas were a top source of energy, protein, carbohydrates, a number of B vitamins, calcium, iron, and zinc, and were the number one source of dietary fiber among toddlers and young children. Again, as a staple food in Mexico, high consumption of tortillas makes them a major contributor to
macro- and micronutrients. On the contrary, although the contribution of vegetables (consumed as discrete items rather than as food mixtures) to nutrient intake was minimal, indicating low vegetable consumption, vegetables appeared to be in the top three or top five sources of fiber among infants. This is due to the high content of fiber in vegetables, even though they are infrequently consumed. On the other hand, the fact that tortillas were the number one source of fiber among toddlers and young children suggests that good food sources of fiber are really lacking and explains why fiber
intake was low in 87% of children aged 1–4 years in Mexico [16]. In addition to the above, we also found that eggs and egg dishes and dried beans (both among the top 10 sources of energy), were top contributors to a number of key nutrients including protein, vitamin A, folate, iron, zinc, potassium, and fiber (dried beans only) in the diet of this population.
4.5. Limitations
This study was cross-sectional in design, so it is not possible to evaluate changes in food sources among the same children as they grow. We used a single day 24-h dietary recall, which may not reflect usual intake. The grouping of food items was designed to reflect local food culture and to help us understand the relative role of specific types of foods and beverages, but the choice of food groups could have had an influence on the rankings. If no detailed information was available, standard recipes were used for foods prepared at home, which could have led to either underestimation or overestimation of certain nutrients. Nevertheless, a major strength of this study is the use of small age
categories and food groups to describe, in detail, the food sources of energy and nutrients and shifts with age in children aged 0–47.9 months using a nationally representative sample of Mexico.
5. Conclusions
This study provides important insights on food sources of energy and nutrients among Mexican children aged 0–47.9 months. The results show that, in addition to milk sources, other types of foods and beverages commonly consumed in Mexico had major contributions to the intakes of energy and nutrients. Foods and beverages high in sugar such as cookies, sweetened breads, and traditional beverages were among the food items commonly consumed from a very young age and contributed increasingly with age to the intake of energy and added sugar. Milk and soups and stews were top
contributors to all nutrients. Tortillas and eggs and egg dishes were among the top contributors to iron and zinc. High-fiber foods like vegetables or dried beans were not the top sources of fiber in the diets of children in Mexico. The intake of more nutrient-dense foods such as vegetables, beans, lean meats, and fortified cereals should be encouraged to help address shortfalls in nutrients. Core foods like soups and stews and eggs and egg dishes were the top contributors to sodium, suggesting that they may be suitable targets for sodium reduction. The findings from this study can assist healthcare
professionals to develop food-based recommendations to correct the inadequate or excessive intake of certain nutrients in the diets of infants and young children in Mexico.
Supplementary Materials: The following are available online at
http://www.mdpi.com/2072-6643/9/5/494/s1, Table S1: Food sources of saturated fat, Table S2: Food sources of thiamine, Table S3: Food sources of riboflavin,
Table S4: Food sources of niacin, Table S5: Food sources of vitamin B6.
Acknowledgments: We acknowledge the help of Barry Popkin in accessing and analyzing the ENSANUT data. We thank Phil Bardsley for his work in managing data and programming. Special thanks to Denise Deming, who wrote an initial version of the abstract for the 2016 Experimental Biology Conference and conducted preliminary analyses. We would like to thank the field workers who assisted with the data collection and also the mothers/infants who participated in the study.
Author Contributions: L.D. contributed to data analysis and was responsible for interpreting the data and writing the manuscript, and had final responsibility for this manuscript. M.C.A. contributed to formulating the research question and data analysis, and interpreted the data. A.L.E. and S.V.-C. contributed to data interpretation and the
critical review and editing of the manuscript. All authors read and approved the final manuscript. Conflicts of Interest: The authors declare no conflict of interest. L.D., M.C.A., and A.L.E. are employees of Nestec, S.A. (Nestlé Research Center), Lausanne, Switzerland and S.V.-C. is an employee of Nestlé Infant Nutrition, Mexico City, Mexico. The opinions expressed in the article are those of the authors alone and do not necessary reflect the views of recommendations of their affiliations.
References
1. Weng, S.F.; Redsell, S.A.; Swift, J.A.; Yang, M.; Glazebrook, C.P. Systematic review and meta-analyses of risk factors for childhood overweight identifiable during infancy. Arch. Dis. Child. 2012, 97, 1019–1026. [CrossRef] [PubMed]
2. Dyer, J.S.; Rosenfeld, C.R. Metabolic imprinting by prenatal, perinatal, and postnatal overnutrition: A review. Semin. Reprod. Med. 2011, 29, 266–276. [CrossRef] [PubMed]
3. Dewey, K.G. The challenge of meeting nutrient needs of infants and young children during the period of complementary feeding: An evolutionary perspective. J. Nutr. 2013, 143, 2050–2054. [CrossRef] [PubMed]
4. Word Health Organization. Guiding Principles for Complementary Feeding of the Breastfed Child; Pan American Health Organization: Washington, DC, USA, 2002.
5. Schwartz, C.; Scholtens, P.A.; Lalanne, A.; Weenen, H.; Nicklaus, S. Development of healthy eating habits early in life. Review of recent evidence and selected guidelines. Appetite 2011, 57, 796–807. [CrossRef] [PubMed]
6. Barquera, S.; Nonato, I.C.; Barrera, L.H.; Pedroza, A.; Rivera, J.Á. Prevalence of obesity in Mexican adults 2000–2012. Salud Pública Mex. 2013, 55, S151–S160. [PubMed]
7. Rivera, J.Á.; de Cosío, T.G.; Pedraza, L.S.; Aburto, T.C.; Sánchez, T.G.; Martorell, R. Childhood and adolescent overweight and obesity in Latin America: A systematic review. Lancet Diabetes Endocrinol. 2014, 2, 321–332. [CrossRef]
8. Rivera-Dommarco, J.Á.; Cuevas-Nasu, L.; González de Cosío, T.; Shamah-Levy, T.; García-Feregrino, R. Stunting in Mexico in the last quarter century: Analysis of four national surveys. Salud Pública Mex. 2013, 55, S161–S169. [PubMed]
9. Villalpando, S.; de la Cruz, V.; Levy, T.S.; Rebollar, R.; Contreras-Manzano, A. Nutritional status of iron, vitamin B12, folate, retinol and anemia in children 1 to 11 years old: Results of the ENSANUT 2012. Salud Pública Mex. 2015, 57, 372–384. [CrossRef] [PubMed]
10. De la Cruz-Góngora, V.; Villalpando, S.; Mundo-Rosas, V.; Shamah-Levy, T. Prevalence of anemia in Mexican children and adolescents: Results from three national surveys. Salud Pública Mex. 2013, 55, S180–S189. [PubMed]
11. Rivera, J.Á.; Pedraza, L.S.; Aburto, T.C.; Batis, C.; Sánchez-Pimienta, T.G.; González de Cosío, T.; López-Olmedo, N.; Pedroza-Tobías, A. Overview of the dietary intakes of the Mexican population: Results from the National Health and Nutrition Survey 2012. J. Nutr. 2016, 146, 1851S–1855S. [CrossRef] [PubMed]
12. Rodríguez-Ramírez, S.; Muñoz-Espinosa, A.; Rivera, J.Á.; González-Castell, D.; González de Cosío, T. Mexican children under 2 years of age consume food groups high in energy and low in micronutrients.J. Nutr. 2016, 146, 1916S–1923S. [CrossRef] [PubMed]
13. Deming, D.M.; Afeiche, M.C.; Reidy, K.C.; Eldridge, A.L.; Villalpando-Carrión, S. Early feeding patterns among Mexican babies: Findings from the 2012 National Health and Nutrition Survey and implications for health and obesity prevention. BMC Nutr. 2015. [CrossRef]
14. Piernas, C.; Miles, D.R.; Deming, D.M.; Reidy, K.C.; Popkin, B.M. Estimating usual intakes mainly affects the micronutrient distribution among infants, toddlers and pre-schoolers from the 2012 Mexican National Health and Nutrition Survey. Public Health Nutr. 2016, 19, 1017–1026. [CrossRef] [PubMed]
15. Pedroza-Tobías, A.; Hernández-Barrera, L.; López-Olmedo, N.; García-Guerra, A.; Rodríguez-Ramírez, S.; Ramírez-Silva, I.; Villalpando, S.; Carriquiry, A.; Rivera, J.Á. Usual vitamin intakes by Mexican populations. J. Nutr. 2016, 146, 1866S–1873S. [CrossRef] [PubMed]
16. López-Olmedo, N.; Carriquiry, A.L.; Rodríguez-Ramírez, S.; Ramírez-Silva, I.; Espinosa-Montero, J.; Hernández-Barrera, L.; Campirano, F.; Martínez-Tapia, B.; Rivera, J.Á. Usual intake of added sugars and saturated fats is high while dietary fiber is low in the Mexican population. J. Nutr. 2016, 146, 1856S–1865S. [CrossRef] [PubMed]
17. Sánchez-Pimienta, T.G.; López-Olmedo, N.; Rodríguez-Ramírez, S.; García-Guerra, A.; Rivera, J.Á.; Carriquiry, A.L.; Villalpando, S. High prevalence of inadequate calcium and iron intakes by Mexican population groups as assessed by 24-hour recalls. J. Nutr. 2016, 146, 1874S–1880S. [CrossRef] [PubMed]
18. Sánchez-Pimienta, T.G.; Batis, C.; Lutter, C.K.; Rivera, J.A. Sugar-sweetened beverages are the main sources of added sugar intake in the Mexican population. J. Nutr. 2016, 146, 1888S–1896S. [CrossRef] [PubMed]
19. Romero-Martínez, M.; Shamah-Levy, T.; Franco-Núñez, A.; Villalpando, S.; Cuevas-Nasu, L.; Gutiérrez, J.P.; Rivera-Dommarco, J.Á. National Health and Nutrition Survey 2012: Design and coverage. Salud Pública Mex. 2013, 55, S332–S340.
20. Devaney, B.; Ziegler, P.; Pac, S.; Karwe, V.; Barr, S.I. Nutrient intakes of infants and toddlers. J. Am. Diet. Assoc. 2004, 104, S14–S21. [CrossRef] [PubMed]
21. Butte, N.F.; Fox, M.K.; Briefel, R.R.; Siega-Riz, A.M.; Dwyer, J.T.; Deming, D.M.; Reidy, K.C. Nutrient intakes of US infants, toddlers, and preschoolers meet or exceed dietary reference intakes. J. Am. Diet. Assoc. 2010, 110, S27–S37. [CrossRef] [PubMed]
22. Instituto Nacional de Salud Pública. Bases de Datos de Valor Nutritivo de los Alimentos (National Institute of Public Health. Food Composition Table); National Institute of Public Health: Cuernavaca, Mexico, 2012.
23. United States Department of Agriculture, Agricultural Research Service. SR-27 Home Page. Available online: https://www.ars.usda.gov/northeast-area/beltsville-md/beltsville-human-… nutrient-data-laboratory/docs/sr27-home-page/ (accessed on 1 April 2015).
24. Brownman, S.A.; Friday, J.E.; Moshfegh, A.J. MyPyramid Equivalents Database, 2.0 for USDA Survey Foods, 2003–2004. Available online: https://www.ars.usda.gov/ARSUserFiles/80400530/pdf/mped/mped2_doc. pdf (accessed on 16 March 2017).
25. University of Minnesota. Nutrition Coordinating Center—NDSR 2016 User Manual. Appendix 11—Nutrient Information, page A11.5. Available online: http://www.ncc.umn.edu/products/ndsr-user-manual/ (accessed on 12 May 2017).
26. Fox, M.K.; Reidy, K.; Novak, T.; Ziegler, P. Sources of energy and nutrients in the diets of infants and toddlers. J. Am. Diet. Assoc. 2006, 106, S28–S42. [CrossRef] [PubMed]
27. Fox, M.K.; Condon, E.; Briefel, R.R.; Reidy, K.C.; Deming, D.M. Food consumption patterns of young preschoolers: Are they starting off on the right path? J. Am. Diet. Assoc. 2010, 110, S52–S59. [CrossRef] [PubMed]
28. Siega-Riz, A.M.; Deming, D.M.; Reidy, K.C.; Fox, M.K.; Condon, E.; Briefel, R.R. Food consumption patterns of infants and toddlers: Where are we now? J. Am. Diet. Assoc. 2010, 110, S38–S51. [CrossRef] [PubMed]
29. Grimes, C.A.; Szymlek-Gay, E.A.; Campbell, K.J.; Nicklas, T.A. Food sources of total energy and nutrients among U.S. Infants and toddlers: National Health and Nutrition Examination Survey 2005–2012. Nutrients 2015, 7, 6797–6836. [CrossRef] [PubMed]
30. Wang, H.; Denney, L.; Zheng, Y.; Vinyes Pares, G.; Reidy, K.; Wang, P.; Zhang, Y. Food sources of energy and nutrients in the diets of infants and toddlers in urban areas of China, based on one 24-hour dietary recall. BMC Nutr. 2015. [CrossRef]
31. Griebler, U.; Bruckmuller, M.U.; Kien, C.; Dieminger, B.; Meidlinger, B.; Seper, K.; Hitthaller, A.; Emprechtinger, R.; Wolf, A.; Gartlehner, G. Health effects of cow’s milk consumption in infants up to 3 years of age: A systematic review and meta-analysis. Public Health Nutr. 2016, 19, 293–307. [CrossRef] [PubMed]
32. Borgna-Pignatti, C.; Marsella, M. Iron deficiency in infancy and childhood. Pediatr Ann. 2008, 37, 329–337. [PubMed]
33. Barquera, S.; Campirano, F.; Bonvecchio, A.; Hernandez-Barrera, L.; Rivera, J.A.; Popkin, B.M. Caloric beverage consumption patterns in Mexican children. Nutr. J. 2010, 9, 47. [CrossRef] [PubMed]
34. Fewtrell, M.; Bronsky, J.; Campoy, C.; Domellof, M.; Embleton, N.; Fidler Mis, N.; Hojsak, I.; Hulst, J.M.; Indrio, F.; Lapillonne, A.; et al. Complementary feeding: A position paper by the European Society for Paediatric Gastroenterology, Hepatology, and Nutrition (ESPGHAN) committee on nutrition. J. Pediatr. Gastroenterol. Nutr. 2017, 64, 119–132. [CrossRef] [PubMed]
35. Baker, R.D.; Greer, F.R. Diagnosis and prevention of iron deficiency and iron-deficiency anemia in infants and young children (0–3 years of age). Pediatrics 2010, 126, 1040–1050. [CrossRef] [PubMed]
36. NORMA Oficial Mexicana NOM-043-SSA2–2012 Basic Health Services. Promotion and Health Education to Food. Criteria to Provide Guidance. Available online: http://dof.gob.mx/nota_detalle_popup.php?codigo= 5285372 (accessed on 16 March 2017).
37. Romero-Velarde, E.; Villalpando-Carrión, S.; Pérez-Lizaur, A.B.; Iracheta-Gerez, M.; Alonso-Rivera, C.G.; López-Navarrete, G.E.; García-Contreras, A.; Ochoa-Ortiz, E.; Zarate-Mondragón, F.; López-Pérez, G.T.; et al. Consenso para las prácticas de alimentación complementaria en lactantes sanos. Bol. Med. Hosp. Infant. Mex.
2016, 73, 338–356.
38. Lozoff, B.; Beard, J.; Connor, J.; Barbara, F.; Georgieff, M.; Schallert, T. Long lasting neural and behavioral effects of iron deficiency in infancy. Nutr. Rev. 2006, 64, S34–S43. [CrossRef] [PubMed]
39. González-Cosío, T.; Rivera-Dommarco, J.; Moreno-Macias, H.; Monterrubio, E.; Sepulveda, J. Poor compliance with appropriate feeding practices in children under 2 y in Mexico. J. Nutr. 2006, 136, 2928–2933.
40. Denney, L.; Reidy, C.K.; Eldridge, A.L. Differences in complementary feeding of 6 to 23 month olds in china, us and Mexico. J. Nutr. Health Food Sci. 2016, 4, 1–8.
41. Tovar, L.R.; Larios-Saldaña, A. Iron and zinc fortification of corn tortilla made either at the household or at industrial scale. Int. J. Vitam. Nutr. Res. 2005, 75, 142–148. [CrossRef] [PubMed]

