Concentrations of oligosaccharides in human milk and child growth
Introduction
Human milk is being explored intensively to understand its composition and physiological role for the breastfed infant. Lipids [1, 2] have been identified as the most significant source of energy in mature milk. Additional important compounds of human milk are proteins, including enzymes and bioactive proteins like antibodies, nitrogenous compounds, and especially nucleotides, which influence the enzyme activity and the functionality of the immune system, hormones, vitamins, water and carbohydrates, including lactose and oligosaccharides. Together with lipids, lactose is an important source of energy, especially for the developing human brain [3]. Human milk oligosaccharides (HMO) form the third largest solid fraction in human milk; they represent about 20% of the total carbohydrates, with an estimated amount of up to 20 g/L in colostrum [4, 5]. HMO are composed of 5 different monosaccharides (Glc, Glucose; GlcNAc, N-Acetylglucosamine; Gal, Galactose; Fuc, Fucose; Neu5Ac, N-Acetylneuraminic acid), which are linked together via glycosidic bonds [6] to produce a wide variety of different structures [7].
HMO have been investigated for their potential role in the early growth of neonates; however, their effects in early and later metabolic health are unclear [8–15]. To date, only 1 study has investigated the association between HMO and growth beyond infancy [12]. The possible underlying biochemical or physiological processes linking HMO and infant growth are not understood. HMO are indigestible but can be fermented at least partly by the infant’s microbiome [16–18]. Thus, they support the maturation of the gastrointestinal tract and the immune system and can protect against the colonization of pathogenic microorganisms by inhibiting their anchoring to human epithelial cells [19–22]. In preclinical models, various studies have examined the effects of HMO (sometimes combined with microbiota) on gut epithelial maturation, differentiation and signaling processes [23–25], which can affect nutrient uptake and developmental programming, as exemplified by their effects on bone formation [26]. HMO concentrations are influenced by lactation stage and maternal genetic factors [27–30] and probably to a lesser extent by maternal weight and body mass index (BMI) before
pregnancy [19, 27, 28].
Therefore, in this study, we aim to assess the association between the oligosaccharide composition in breast milk at 3 months postpartum and a) maternal factors (maternal age, pre-pregnancy BMI), b) the child’s birth parameters (anthropometric measurements, gestational age (GA)) and c) the subsequent growth until the age of 7 years (height, growth velocity, head circumference (HC), BMI). According to the literature, we hypothesize only weak associations between HMO concentrations and the maternal factors. Further, we expect associations between HMO and the child’s anthropometric measurements, with higher effects in the first year of life and lower effects for older ages.
Methods
Study design and participants
All data were collected within the LIFE Child study at the Research Centre for Civilization Diseases in Leipzig, Germany (www. Clini calTr ial. gov: NCT02550236). Children and their parents have been recruited from the 24th week of gestation to 16 years of age to investigate environmental, metabolic and genetic associations with children’s development [31]. The study is described in detail elsewhere [31, 32].
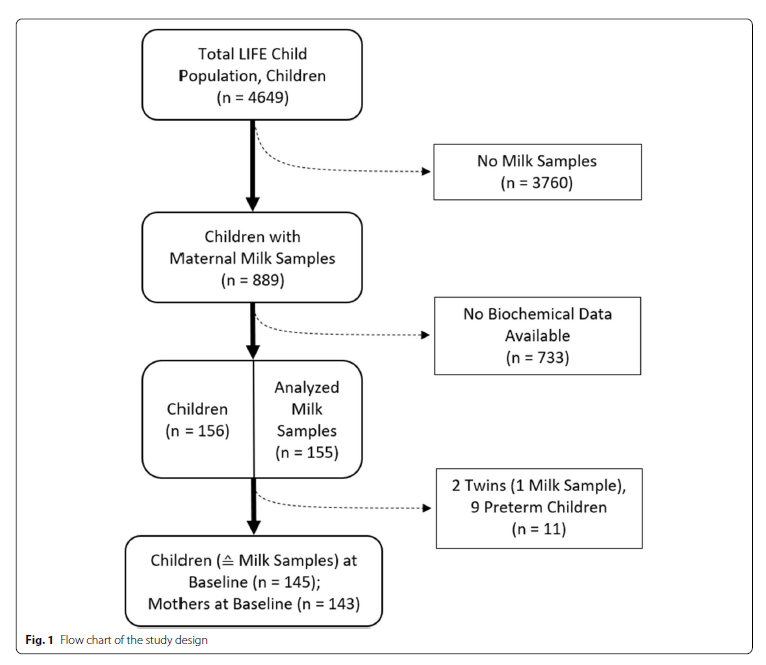
Between 2011 and 2014, 155 milk samples were collected from 153 mothers who nurse at the 3-month baseline visit (Fig. 1). The 3-month-visit took place after their 2nd full month and before the end of the 1st week of their 4th month of life. We excluded 1 sample because of a twin pregnancy and 9 samples because of preterm birth. Two mothers contributing 2 pregnancies were included. Finally, 145 sample-children combinations were included. Further, 132 (91%) follow-up measurements were documented at 6 months, 122 (84%) at 1 year, 106 (73%) at 2 years, 104 (72%) at 3 years, 90 (62%) at 4 years, 87 (60%) at 5 years, 59 (41%) at 6 years, and 37 (26%) at 7 years of age.
Informed written consent was provided by all parents for their children, participation in each procedure were voluntary. The study has been conducted per the Declaration of Helsinki. The study protocol was approved by the Ethics Committee of the Medical Faculty of the University of Leipzig (Reg. No. 264-10-19042010).
Milk collection, storage and analysis
Under private conditions, about 20 mL of milk was collected at the 3-month visit using a milk pump (Medela Symphony®). The samples were obtained during the morning before lunchtime (1 pm). The first 20 mL was used. The milk was within at most 20 min stored without processing at − 80 °C at our biobank [31] until its transport to Nestlé Research, Lausanne, on dry ice. The concentrations of 9 HMO were determined by liquid chromatography with fluorescence detection following a previously described validated method [33]. The calibration standards of 2′-fucosyllactose (2’FL), 3-fucosyllactose (3-FL), 3′-sialyllactose (3′SL), 6′-sialyllactose (6′SL),
lacto-N-tetraose (LNT), lacto-N-neotetraose (LNnT), lacto-N-fucopentaose-I (LNFP-I), lacto-N-fucopentaose- V (LNFP-V) and lacto-N-neofucopentaose (LNnFP) were purchased from Elicityl (Crolles, France), where the HMO content of the standard powders was determined by quantitative nuclear magnetic resonance spectrometry. For each HMO, 9 point calibration curves were prepared in the ranges 2’FL: 10–4900 mg/L, 3-FL: 10–2800 mg/L, 3′SL: 2–900 mg/L, 6′SL: 2–900 mg/L, LNT: 4–1900 mg/L, LNnT: 2–1000 mg/L, LNFP-I: 4–2000 mg/L, LNFP-V: 2–900 mg/L, LNnFP: 2–900 mg/L. With each batch of analysis (or every 25 samples if batches were larger) a reference pooled human milk sample (Lee Biosolutions, Maryland Heights, USA) was analyzed to ensure the method performance remained consistent between days and between batches of analyses.
Measurements
Maternal pre-pregnancy weight and height and the child’s birth parameters were taken from the maternity log (“Mutterpass”) [34]. This booklet is updated by medical staff during pregnancy checkups.
Measurements were taken by trained research assistants according to standard procedures. Height/length was measured using the Dr. Keller II infantometer until 1 year of age and the Dr. Keller I stadiometer afterward. Weight was determined by using a scale (the seca 757 or the seca 701). HC was measured using a non-dilatable measuring tape. BMI was calculated. Height/length, weight, and BMI were transformed to standard deviation scores (SDS) according to the guidelines from the German Working Group on Obesity in Childhood and Adolescence [35]. HC measurements were transformed to SDS using German standards from the KiGGS study [36]. As a measure of growth, growth velocity was calculated as the standardized difference between the 3-month height and the 1-year height of the child and afterward between 2 consecutive height measures.
Statistical analyses
All statistical analyses were carried out using R 4.0 [37]. Descriptive statistics were given as median [Q1;Q3] for HMO and mean (standard deviation) for the other continuous variables (Table 1). For all HMO, values below the limit of quantification (LoQ) were set to the LoQ and marked as left censored. Correlations (r) between specific HMO were investigated using Pearson correlations on the log-transformed values. Secretor status was determined based on the 2’FL concentration, with values below the LoQ of ≤53 mg/L corresponding to mothers who are non-secretors (NSM) and > 53 mg/L corresponding to mothers who are secretors (SM) [30, 33].

For HMO, the differences in medians between SM and NSM were tested using Kruskal-Wallis tests or censored regression models when data below the LoQ occurred. For the other continuous variables, differences in means were tested using t-tests. Chi-squared tests were applied to test differences in proportions. The associations between the HMO and the children’s and mothers’ parameters were examined using generalized additive models for location, shape, and scale [38, 39], with HMO as the outcome and the other variables as predictor variables. Modeling was done separately for each age group, assuming a log-linear relationship between predictor and outcome. Due to the HMO values’ considerable skewness, these values were log-transformed. A Box-Cox Cole and Green distribution or its censored equivalent was chosen to describe the outcomes’ distributions. Investigating the models’ error structure revealed variances according to secretor status. Therefore, variance was modeled dependent on secretor status. Skewness was dependent on secretor status only for LNnT. With evidence of an interaction between the predictor and the secretor status, the respective interaction term was included in the model. The models’ appropriateness was checked using different plots (QQ-plot, variance against fitted, variance against covariates, influence vs. cooks distance; plots not shown). Effects are reported as ratios (R = exp(β)) or differences (β), including the 95% confidence interval. As NSM values of LNFP-I and 2’FL were below the LoQ (≤15 mg/L and 53 mg/L, respectively) [33], associations involving LNFP-I and 2’FL were only modeled in the SM subgroup. P-values ≤0.05 were considered to be statistically significant. Because of the complex dependencies between the tested items, p-values were not adjusted for multiple testing. Essentially, we stress the fact that the results should be interpreted in terms of the occurring patterns instead of emphasizing single significant test results.
Results
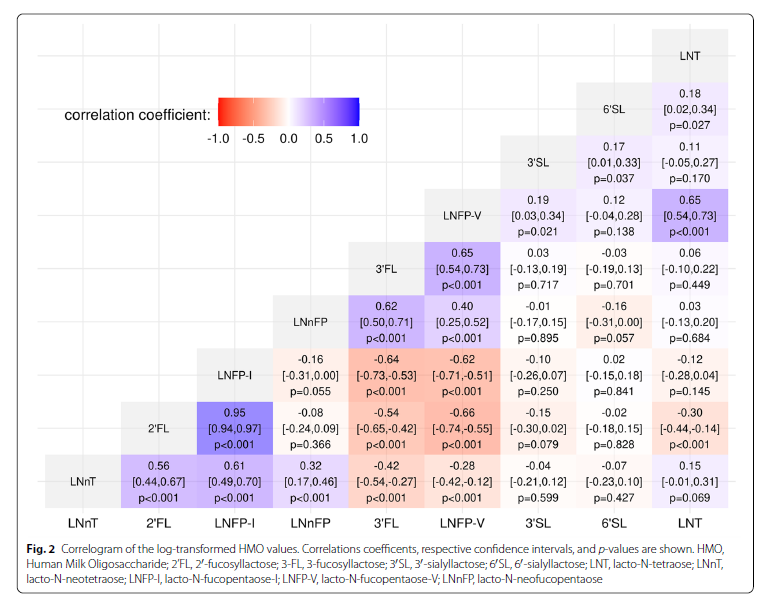
Descriptive statistics and correlations between HMO The cohort consists of 21 (14.7%) NSM and 122 (85.3%) SM. Two of the SM took part with 2 singleton pregnancies (Fig. 1). 2’FL, LNFP-I and LNnT concentrations were significantly lower in NSM, while 3-FL, 3′SL, LNT and LNFP-V concentrations were higher. Further descriptive statistics are given in Table 1. Correlation was highest between 2’FL and LNFP-I (r = 0.95, p < 0.001). Both were also positively correlated to LNnT (2’FL: r = 0.56, p < 0.001; LNFP-I: r = 0.61, p < 0.001) and negatively correlated to LNFP-V (2’FL: r = − 0.66, p < 0.001; LNFP-I: r = − 0.62, p < 0.001) and 3-FL (2’FL: r = − 0.54, p < 0.001; LNFP-I: r = − 0.64, p < 0.001) (Fig. 2).
Maternal parameters, gestational age and birth parameters
The maternal age at birth was positively associated only with 3′SL (R = 1.06 [1.00,1.11] for every 5 years older, p = 0.03). Pre-pregnancy BMI was negatively associated with LNnT in NSM (R = 0.93 [0.90,0.97], p < 0.001); no association was found in SM. GA was positively associated with LNT (R = 1.08 [1.01,1.15], p = 0.03), 6′SL (R = 1.09 [1.03,1.16], p = 0.005) and LNFP-I (R = 1.15 [1.03,1.28], p = 0.012, only children from SM (SC)). LNFP-I (R = 1.2, [1.05,1.37], p = 0.008, only SC) and 3-FL (R = 0.92 [0.86,0.98], p = 0.011) were significantly associated with birth length (Supplementary Table S1).
Height‑SDS and growth velocity
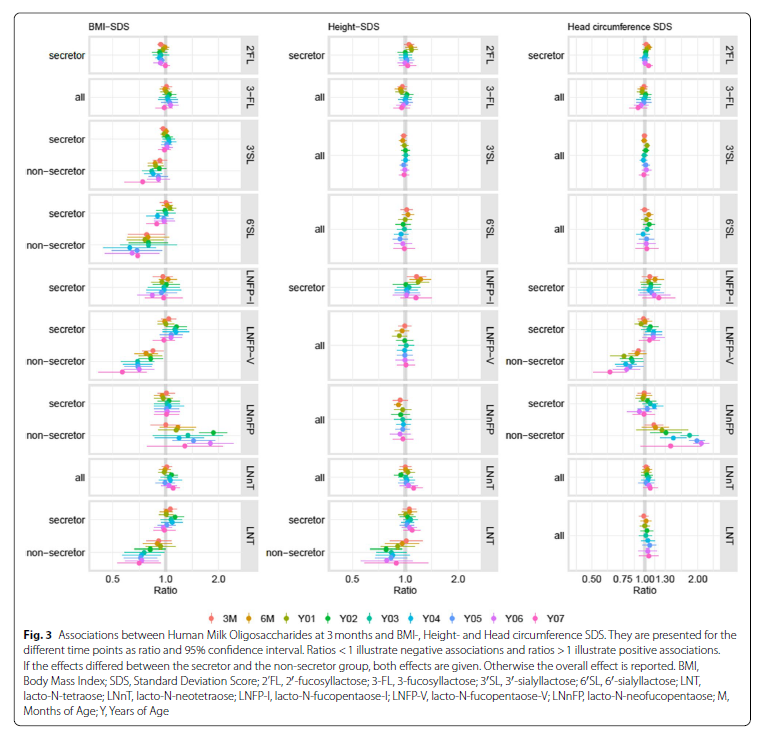
The interaction between height-SDS and secretor status was significant for LNT. The association of height- SDS with LNT had a negative direction in children of NSM (NSC) (0.78 ≤ R ≤ 1.01) and a positive direction in SC (1.00 ≤ R ≤ 1.09; Supplementary Table S2; Fig. 3). However, the effects reached significance only for NSC at 2Y. LNFP-I was positively associated with height-SDS effects at 3 M, 6 M and 1Y (R ≈ 1.2, p ≤ 0.02); afterward, no further associations were found. Besides, there were consistently positive associations between height SDS and LNnT. However, statistical significance was only reached at 6Y. There was no evidence of associations between height-SDS and 2’FL, 3-FL, 3′SL, 6′SL, LNnFP, or LNFP-V.
The interaction between growth velocity and secretor status was significant for LNnT. In NSC, we found negative effects for 3 M–1Y (R = 0.95 [0.90,0.99], p = 0.01), 1Y–2Y (R = 0.80 [0.72,0.88], p < 0.001) and for 5Y–6Y (R = 0.71 [0.57,0.87], p = 0.002).
LNT and LNFP-V were negatively associated with growth velocity from 3 M–1Y (LNT: R = 0.97 [0.95,1.00], p = 0.02; LNFP-V: R = 0.97 [0.95,1.00], p = 0.04). LNFP-I and 3′SL were negatively associated with growth velocity from LNFP-I: 1Y–2Y (R = 0.90 [0.83,0.97] p = 0.008) and 3′SL: 4Y–5Y (R = 0.95 [0.90,1.00] p = 0.045). No significant associations were found for growth velocity and 2’FL, 3-FL, 6′SL and LNnFP (Supplementary Table S3).
BMI‑SDS
The interaction between BMI-SDS and secretor status was significant for 3′SL, 6′SL, LNT, LNFP-V and LNnFP. For NSC, we found consistently negative associations between BMI-SDS and 3′SL, 6′SL, LNT and LNFPV at all time points (Supplementary Table S4; Fig. 3). However, statistical significance was reached only for LNT and LNFP-V at 2Y. Besides, we found consistently positive associations between BMI-SDS and LNnFP from 6 M onward. Statistical significance was reached at 02Y, 05Y and 06Y. We did not find evidence of associations between BMI-SDS and the HMO in SC when the models included the interaction term.
2’FL showed consistently negative associations with BMI-SDS (0.92 ≤ R ≤ 1; Supplementary Table S4; Fig. 3); statistical significance was reached at 3 M, 4Y and 5Y. The 3-FL was consistently positively associated with BMISDS between 3 M and 6Y; however, the results did not reach statistical significance. For LNnT and LNFP-I, no consistent patterns were found.
Head circumference
The interaction between HC and secretor status was significant for LNFP-V and LNnFP. LNFP-V showed consistent, significantly negative associations with HC between 3 M and 7Y, with effect sizes varying between 0.63 and 0.92 in NSC (Supplementary Table S5; Fig. 3). SC had no notable pattern. LNnFP showed consistently positive effects on HC from 3 M–7Y, with effect sizes between 1.12 and 2.09 in NSC. In general, the effect sizes increased with age. Statistical significance was reached from 2Y–6Y. Again, we found no notable patterns in SC. LNFP-I was consistently positively related to HC-SDS from 6 M–7Y with effect sizes between 1.02 and 1.20. However, most of the effects did not reach significance. There were no notable pattern or effects for 2’FL, 3-FL, 3′SL, 6′SL or LNT (Supplementary Table S5; Fig. 3).
Comparisons in children of non‑secretors vs. secretors
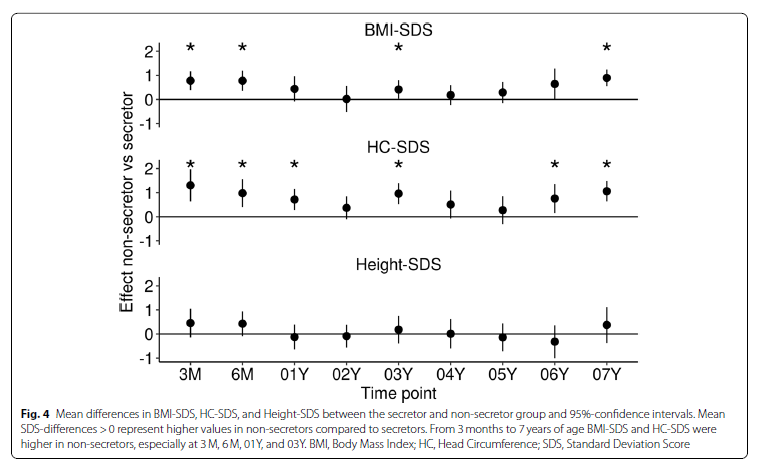
NSC had a significantly higher BMI-SDS at 3 M (β = 0.8 [0.4,1.2], p < 0.001) and 6 M (β = 0.8 [0.4,1.2], p < 0.001). At 1 year, the direction of the association remained the same but the difference was not significant (Fig. 4). At 3 M and 6 M, NSC tended to show an approximately + 0.5 higher height-SDS. However, there was no statistically significant effect. HC-SDS was astoundingly higher in NSC at 3 M (β = 1.3 [0.6,2.0], p < 0.001), 6 M (β = 1.0 [0.4,1.6], p = 0.001), and 1Y (β = 0.7 [0.3,1.2], p = 0.002). Even afterwards, HC-SDS stayed higher in NSC with effect sizes between β = 0.4 and β = 1.0, reaching significance at 3Y, 6Y, and 7Y (Fig. 4).
Discussion
Our study aimed to investigate how HMO are associated with infant anthropometry from 3 months to 7 years of age and to identify any consistent patterns that could signify an important role of HMO for early growth. We found a consistent inverse association of growth velocity with LNnT only in NSC group. In addition, NSC had consistently higher BMI than SC. We also explored the influence of maternal and infant factors in HMO composition with maternal age, gestational age and pre-pregnancy BMI significantly associated with some of the HMO.
Recent studies proposed that HMO, besides their antimicrobial effects, may be involved in infant growth and development. HMO are indigestible but can be fermented, at least partially, by the infant’s microbiome [16–18, 20, 40–42]. This promotes the growth and activity of commensal bacteria such as Bifidobacterium and Bacteroides spp. and supports the gastrointestinal tract’s maturation and the immune system [43]. HMO may also reduce the risk of infections by protecting against colonization with pathogenic microorganisms. It is proposed that they can act as decoys, inhibiting the pathogen anchoring to the human epithelial cells [21, 22, 44, 45].
It was recently suggested that sialylated oligosaccharides may exert a microbiota-dependent promotion of anabolic function in animal models by increasing the nutrient’s efficiency, promoting better growth and physical development [46, 47]. Given the HMO-microbiome interaction and the microbiome’s proposed effect on
nutrient efficiency, combined with maternal factors as pre-pregnancy BMI, the HMO composition of breast milk may also affect infant growth. Previous studies [9, 10, 12–14] investigating associations between HMO and infant growth obtained conflicting results. Alderete et al. identified associations between LNFP-I and lower infantile weight, but not with pre-pregnancy BMI [10]. In contrast, more recent studies found 2’FL positively associated with both child growth and pre-pregnancy [12, 13]. Other studies reported no associations between HMO composition or secretor status with child growth [9, 14].
Despite the variability in results, 2 recent studies indicated a role of sialylated HMO in infant growth considering maternal BMI [14, 48]. Binia et al. found moderate associations between HMO and infant growth and body composition during the first 4 months of life in a cohort of predominantly healthy babies and mothers with normal BMI. They reported significant associations of higher growth rate during the 4 months of lactation with higher 3′SL, expressed as Area Under the Curve of HMO concentrations at all visits, a potentially better measure of HMO exposure. Saben et al. confirmed the positive association of several sialylated HMO, including 3′SL but also total acidic HMO with infant growth during the first 6 months of life, including also mothers with obesity. The growth and body composition of the healthy infants were independent of maternal pre-pregnancy BMI. Interestingly, Saben et al. used calculated milk and HMO intake and not only concentrations, an attempt again to better quantify exposure to HMO. The study was limited to 1 single time-point of HMO quantification at 2 months. Both studies lacked the longer follow-up of infant growth, which could be a better indicator of future risk to obesity. Finally, neither of these 2 studies confirmed the previous observations by Lagström et al. [12] and Larsson et al. [13] on the positive association of 2’FL and the negative association of LNnT with infant growth. Another rare example of HMO intake being quantitatively measured looked at HMO intake at several time points up to 12 months. However, the total (not individual) HMO intake was calculated. They found higher HMO concentrations associated with higher percentages of the fat-free mass at 2, 5, 9, and 12 months of age, whereas fat mass was negatively related to higher HMO intake at 5, 9, and 12 months of age [49].
Despite measuring HMO only at 3 months postpartum from only 20 mL of milk and no full breast expression, limiting insights on associations between growth and the changing HMO exposure over time, we could include growth data from birth until 7 years of age in a relatively strong sample size for this long follow-up compared to other studies. Indeed, we found higher BMI and HC SDS in NSC than SC. Although significance was not achieved at all time points, the probability of only positive results is p < 0.002. Growth velocity but not BMI was inversely correlated with LNnT at 3 M–1Y and 1Y–2Y in NSC, supporting the findings from Lagström et al. [12]. Regarding the association between infant growth and sialylated HMO 3′SL and 6′SL, we found a negative association with BMI-SDS in NSC but not with growth velocity, as previously reported [14, 48]. Our study is an exploratory approach to identify associations between maternal, infant parameters and HMO. Our findings could be affected by false positive results, however the associations of growth velocity with LNnT and BMI with 2’FL are consistent for multiple time-points. We did not have milk intake measurements available in our study; future studies need to include these parameters to estimate more accurately the exposure of the infant gastrointestinal tract to HMO.
Included mothers had a mean BMI of 23.2 (3.78) kg/m2 and a mean age of 30 years, similar to other study populations [14, 48]. In line with previous results, we found a negative association between pre-pregnancy BMI and LNnT in NSM [12]. However, other studies reported a positive or no association [27, 28, 48]. This highlights the variability of reported HMO associations, reflecting possible differences in methods or non-measured confounders. Therefore, future studies examining the role of HMO in growth and metabolic health should consider maternal physiology and other human milk components, such as proteins and lipids.
One in vivo intervention study with sialylated oligosaccharides [47] did report growth recovery following treatment with sialylated oligosaccharides in animal models of undernutrition. Recent randomized placebo controlled clinical trials testing infant formula containing specific individual HMO (2’FL or 2’FL and LNnT) effect on growth showed no differences in infant growth up to 12 months of age [50, 51]. Their results may imply that the impact of single or a few HMO may not have a large effect in the growth of healthy infants. In addition, these trials were randomized, whereas observational studies are not and factors other than HMO may confound associations. Ideally, future intervention studies with HMO mixes closer to those in human milk should be followed beyond the first year of life. Observational studies like the present could highlight the importance of maternal and infant characteristics in the relationship between HMO and infant growth and development. The conflicting reported results however from recent observational data call for hypothesis-driven studies with detailed meta-data collection to test the specific role of groups rather than single HMO in influencing early growth and composition.
Conclusion
Our results suggest that associations between HMO and infant growth may extend beyond the breastfeeding period and interventional studies are needed to elucidate their influence on infant weight, height and body composition. Our study also confirms the value of long term follow-up of breastfed infants and the inclusion of both maternal and infant factors to understand the role of HMO in growth and development [27, 29].
Abbreviations
HMO: Human Milk Oligosaccharide; 2’FL: 2′-fucosyllactose; 3-FL: 3-fucosyllactose; 3′SL: 3′-sialyllactose; 6′SL: 6′-sialyllactose; LNT: Lacto-N-tetraose; LNnT: Lacto-N-neotetraose; LNFP-I: Lacto-N-fucopentaose-I; LNFP-V: Lacto-N-fucopentaose-V; LNnFP: Lacto-N-neofucopentaose; SM: Mothers who are Secretors; NSM: Mothers who are Non-Secretors; SC: Children of Mothers who are Secretors; NSC: Children of Mothers who are Non-Secretors; BMI: Body Mass Index; HC: Head Circumference; GA: Gestational Age; SDS: Standard Deviation Score; Glc: Glucose; GlcNAc: N-Acetylglucosamine; Gal: Galactose; Fuc: Fucose; Neu5Ac: N-Acetylneuraminic acid; LoQ: Limit of Quantification.
Supplementary Information
The online version contains supplementary material available at https:// doi.org/ 10. 1186/ s12887- 021- 02953-0.
Additional file 1: Supplementary Table S1. Associations between Human Milk Oligosaccharides at 3 months and maternal and birth parameter are presented as ratio, 95% confidence interval, and p-value. If the effects differed between the secretor and the non-secretor group, both effects are given. Otherwise the overall effect is reported. Supplementary Table S2. Associations between Human Milk Oligosaccharides at 3 months and height-SDS at the different time points are presented as ratio, 95% confidence interval, and p-value. If the effects differed between the secretor and the non-secretor group, both effects are given. Otherwise the overall effect is reported. Supplementary Table S3. Associations between Human Milk Oligosaccharides at 3 months and growth velocity at the different time points are presented as ratio, 95% confidence interval, and p-value. If the effects differed between the secretor and the non-secretor group, both effects are given. Otherwise the overall effect is reported. Supplementary Table S4. Associations between Human Milk Oligosaccharides at 3 months and BMI-SDS at the different time points are presented as ratio, 95% confidence interval, and p-value. If the effects differed between the secretor and the non-secretor group, both effects are given. Otherwise the overall effect is reported. Supplementary Table S5. Associations between Human Milk Oligosaccharides at 3 months and Head Circumference SDS at the different time points are presented as ratio, 95% confidence interval, and p-value. If the effects differed between the secretor and the non-secretor group, both effects are given. Otherwise the overall effect is reported.
Acknowledgements
The authors would like to thank all participants, the Life Child Study Investigators, and the Life Child colleagues for their advice.
Authors’ contributions
WK and AB conceived of the presented idea. NG, AJ, and CH were in charge of study organization and data collection. AB, SA, and NS were in charge of HMO analyses. PM and MV performed the statistical analyses, interpreted the results, wrote the first draft of the manuscript, and designed the visualizations. All authors discussed and contributed to the manuscript. All authors reviewed the results and approved the final manuscript as submitted and agree to be accountable for all aspects of the work.
Funding
This publication is supported by LIFE, Leipzig Research Center for Civilization Diseases, University of Leipzig. LIFE is funded by means of the European Union, by means of the European Social Fund (ESF), by the European Regional Development Fund (ERDF), and by means of the Free State of Saxony within the framework of the excellence initiative. Open Access funding enabled and organized by Projekt DEAL.
Availability of data and materials
The legal requirements and the given informed consent do not allow public sharing of the dataset. Interested researchers can contact the research data management of the Medical Faculty, University Leipzig: rdm@ mediz in. unileipzig. de for further information. The dataset ID is PV450.
Declarations
Ethics approval and consent to participate
The study has been conducted in accordance with the Declaration of Helsinki. The study protocol was approved by the Ethics Committee of the Medical Faculty of the University of Leipzig (Reg. No. 264-10-19042010). Informed written consent was provided by all parents for their children.
Consent for publication
Not applicable.
Competing interests
Aristea Binia, Sean Austin and Norbert Sprenger are employees of Société des Produits Nestlé. All other authors declare no conflict of interest.
Author details
1 Leipzig University, Leipzig University Hospital for Children and Adolescents, LIFE Child, Ph.‑Rosenthal‑Str. 27, 04103 Leipzig, Germany. 2 Center for Pediatric Research, Leipzig University, Department of Women and Child Health, Leipzig University, Liebigstr. 20a, 04103 Leipzig, Germany. 3 Nestlé Research, Société des Produits Nestlé SA, Route du Jorat 57, 1000 Lausanne, Switzerland
References
1. Koletzko B, Rodriguez-Palmero M, Demmelmair H, Fidler N, Jensen R, Sauerwald T. Physiological aspects of human milk lipids. Early Hum Dev. 2001;65:S3–18.
2. Demmelmair H, Koletzko B. Lipids in human milk. Best Pract Res Clin Endocrinol Metab. 2018;32(1):57–68.
3. Truchet S, Honvo-Houéto E. Physiology of milk secretion. Best Pract Res Clin Endocrinol Metab. 2017;31(4):367–84.
4. Urashima T, Asakuma S, Leo F, Fukuda K, Messer M, Oftedal OT. The predominance of type I oligosaccharides is a feature specific to human breast Milk123. Adv Nutr. 2012;3(3):473S–82S.
5. Kunz C, Meyer C, Collado M, Geiger L, García-Mantrana I, Bertua-Ríos B, et al. Influence of gestational age, secretor, and Lewis blood group status on the oligosaccharide content of human Milk. J Pediatr Gastroenterol Nutr. 2017;64(5):789–98.
6. International Union of Pure and Applied Chemistry, editor. Compendium of Chemical Terminology - Gold Book. 2014.
7. Urashima T, Hirabayashi J, Sato S, Kobata A. Human milk oligosaccharides as essential tools for basic and application studies on galectins. Trends Glycosci Glycotechnol. 2018;30(172):SE51–65.
8. Maessen SE, Derraik JGB, Binia A, Cutfield WS. Perspective: human milk oligosaccharides: fuel for childhood obesity prevention? Adv Nutr. [cited
2019 Oct 22]; Available from: https:// acade mic. oup. com/ advan ces/ advance- artic le/ doi/ 10. 1093/ advan ces/ nmz093/ 55615 98.
9. Sprenger N, Lee LY, De Castro CA, Steenhout P, Thakkar SK. Longitudinal change of selected human milk oligosaccharides and association to infants’ growth, an observatory, single center, longitudinal cohort study. PLoS One. 2017;12(2) [cited 2019 Feb 14]. Available from: https:// www.ncbi. nlm. nih. gov/ pmc/ artic les/ PMC53 00226/.
10. Alderete TL, Autran C, Brekke BE, Knight R, Bode L, Goran MI, et al. Associations between human milk oligosaccharides and infant body composition in the first 6 mo of life. Am J Clin Nutr. 2015;102(6):1381–8.
11. Dotz V, Rudloff S, Meyer C, Lochnit G, Kunz C. Metabolic fate of neutral human milk oligosaccharides in exclusively breast-fed infants. Mol Nutr Food Res. 2015;59(2):355–64.
12. Lagström H, Rautava S, Ollila H, Kaljonen A, Turta O, Mäkelä J, Yonemitsu C, Gupta J, Bode L. Associations between human milk oligosaccharides and growth in infancy and early childhood. Am J Clin Nutr. 2020;111(4):769–78.
13. Larsson MW, Lind MV, Laursen RP, Yonemitsu C, Larnkjær A, Mølgaard C, et al. Human milk oligosaccharide composition is associated with excessive weight gain during exclusive breastfeeding—an explorative study. Front Pediatr. 2019;7 [cited 2020 Mar 31]. Available from: https:// www.ncbi. nlm. nih. gov/ pmc/ artic les/ PMC66 57391/.
14. Binia A, Lavalle L, Chen C, Austin S, Agosti M, Al-Jashi I, Pereira AB, Costeira MJ, Silva MG, Marchini G, Martínez-Costa C, Stiris T, Stoicescu SM, Vanpée M, Rakza T, Billeaud C, Picaud JC, Domellöf M, Adams R, Castaneda-Gutierrez E, Sprenger N. Human milk oligosaccharides, infant growth, and adiposity over the first 4 months of lactation. Pediatr Res. 2021;90(3):684–93.
15. Tonon KM, de Morais MB, Abrão ACFV, Miranda A, Morais TB. Maternal and infant factors associated with human milk oligosaccharides concentrations according to secretor and lewis phenotypes. Nutrients. 2019;11(6):1358.
16. Löffler G, Petrides PE, Heinrich PC. Biochemie und Pathobiochemie. 8., völlig neu bearb. Aufl. 2007. Heidelberg: Springer; 2006. p. 1266.
17. Borewicz K, Gu F, Saccenti E, Arts ICW, Penders J, Thijs C, et al. Correlating infant fecal microbiota composition and human milk oligosaccharide consumption by microbiota of 1-month-old breastfed infants. Mol NutrFood Res. 2019;63(13) [cited 2020 Mar 16]. Available from: https:// www.ncbi. nlm. nih. gov/ pmc/ artic les/ PMC66 18098/.
18. Walker WA, Iyengar RS. Breast milk, microbiota, and intestinal immune homeostasis. Pediatr Res. 2015;77(1–2):220–8.
19. Bode L, Jantscher-Krenn E. Structure-function relationships of human milk oligosaccharides123. Adv Nutr. 2012;3(3):383S–91S.
20. Ward RE, Niñonuevo M, Mills DA, Lebrilla CB, German JB. In vitro fermentation of breast Milk oligosaccharides by Bifidobacterium infantis and lactobacillus gasseri. Appl Environ Microbiol. 2006;72(6):4497–9.
21. Thai JD, Gregory KE. Bioactive factors in human breast milk attenuate intestinal inflammation during early life. Nutrients. 2020;12(2):581.
22. Coppa GV, Zampini L, Galeazzi T, Facinelli B, Ferrante L, Capretti R, et al. Human milk oligosaccharides inhibit the adhesion to Caco-2 cells of diarrheal pathogens: Escherichia coli, Vibrio cholerae, and Salmonella fyris. Pediatr Res. 2006;59(3):377–82.
23. Kuntz S, Kunz C, Rudloff S. Oligosaccharides from human milk induce growth arrest via G2/M by influencing growth-related cell cycle genes in intestinal epithelial cells. Br J Nutr. 2009;101(9):1306–15.
24. Eiwegger T, Stahl B, Haidl P, Schmitt J, Boehm G, Dehlink E, et al. Prebiotic oligosaccharides: in vitro evidence for gastrointestinal epithelial transfer and immunomodulatory properties. Pediatr Allergy Immunol. 2010;21(8):1179–88.
25. Rudloff S, Stefan C, Pohlentz G, Kunz C. Detection of ligands for selectins in the oligosaccharide fraction of human milk. Eur J Nutr. 2002;41(2):85–92.
26. Cowardin CA, Ahern PP, Kung VL, Hibberd MC, Cheng J, Guruge JL, et al. Mechanisms by which sialylated milk oligosaccharides impact bone biology in a gnotobiotic mouse model of infant undernutrition. Proc Natl Acad Sci U S A. 2019;116(24):11988–96.
27. Azad MB, Robertson B, Atakora F, Becker AB, Subbarao P, Moraes TJ, et al. Human milk oligosaccharide concentrations are associated with multiple fixed and modifiable maternal characteristics, environmental factors, and feeding practices. J Nutr. 2018;148(11):1733–42.
28. Samuel TM, Binia A, de Castro CA, Thakkar SK, Billeaud C, Agosti M, et al. Impact of maternal characteristics on human milk oligosaccharide composition over the first 4 months of lactation in a cohort of healthy European mothers. Sci Rep. 2019;9 [cited 2020 Mar 16]. Available from: https:// www. ncbi. nlm. nih. gov/ pmc/ artic les/ PMC66 92355/.
29. Coppa GV, Gabrielli O, Pierani P, Catassi C, Carlucci A, Giorgi PL. Changes in carbohydrate composition in human milk over 4 months of lactation. Pediatrics. 1993;91(3):637–41.
30. Lefebvre G, Shevlyakova M, Charpagne A, Marquis J, Vogel M, Kirsten T, et al. Time of lactation and maternal fucosyltransferase genetic polymorphisms determine the variability in human milk oligosaccharides. Front Nutr. 2020;7:574459.
31. Quante M, Hesse M, Döhnert M, Fuchs M, Hirsch C, Sergeyev E, et al. The LIFE child study: a LIFE course approach to disease and health. BMC Public Health. 2012;12:1021.
32. Poulain T, Baber R, Vogel M, Pietzner D, Kirsten T, Jurkutat A, et al. The LIFE child study: a population-based perinatal and pediatric cohort in Germany. Eur J Epidemiol. 2017;32(2):145–58.
33. Austin S, De Castro CA, Bénet T, Hou Y, Sun H, Thakkar SK, et al. Temporal change of the content of 10 oligosaccharides in the milk of chinese urban mothers. Nutrients. 2016;8(6) [cited 2019 Mar 3]. Available from: https:// www. ncbi. nlm. nih. gov/ pmc/ artic les/ PMC49 24187/.
34. Goeckenjan M, Brückner A. Vetter K [Prenatal Care]. Der Gynäkologe. 2021;54:579–89.
35. Wabitsch M, Kunze D. Konsensbasierte (S2) Leitlinie zur Diagnostik, Therapie und Prävention von Übergewicht und Adipositas im Kindes-und Jugendalter [Evidence-based therapy guideline of the German Working Group on Obesity in Childhood and Adolescence]. Version 15.10. 2015; www.a- g-a. de. :116.
36. Stolzenberg H, Kahl H, Bergmann KE. Body measurements of children and adolescents in Germany. Results of the German Health Interview and Examination Survey for Children and Adolescents (KiGGS). Bundesgesundheitsblatt Gesundheitsforschung Gesundheitsschutz. 2007;50(5–6):659–69.
37. R Core Team. R: A language and environment for statistical computing. Vienna: R Foundation for Statistical Computing; 2020. Available from: https:// www.R- proje ct. org/
38. Stasinopoulos MD, Rigby RA, Bastiani FD. GAMLSS: A distributional regression approach. Stat Model. 2018;18(3–4):248–73.
39. Stasinopoulos M, Rigby B, Mortan N. gamlss.cens: Fitting an Interval Response Variable Using ‘gamlss.family’ Distributions. 2018 [cited 2021 Jan 31]. Available from: https:// CRAN.R- proje ct. org/ packa ge= gamlss. cens
40. Cabrera-Rubio R, Collado MC, Laitinen K, Salminen S, Isolauri E, Mira A. The human milk microbiome changes over lactation and is shaped by maternal weight and mode of delivery. Am J Clin Nutr. 2012;96(3):544–51.
41. Obermajer T, Lipoglavšek L, Tompa G, Treven P, Lorbeg PM, Matijašić BB, et al. Colostrum of healthy slovenian mothers: microbiota composition and bacteriocin gene prevalence. PLoS One. 2015;10(4) [cited 2018 Sep 21]. Available from: https:// www. ncbi. nlm. nih. gov/ pmc/ artic les/ PMC44 12836/.
42. Martín R, Langa S, Reviriego C, Jimínez E, Marín ML, Xaus J, et al. Human milk is a source of lactic acid bacteria for the infant gut. J Pediatr. 2003;143(6):754–8.
43. Jost T, Lacroix C, Braegger C, Chassard C. Impact of human milk bacteria and oligosaccharides on neonatal gut microbiota establishment and gut health. Nutr Rev. 2015;73(7):426–37.
44. Morrow AL, Ruiz-Palacios GM, Altaye M, Jiang X, Guerrero ML, Meinzen- Derr JK, et al. Human milk oligosaccharides are associated with protection against diarrhea in breast-fed infants. J Pediatr. 2004;145(3):297–303.
45. Jiang X, Huang P, Zhong W, Tan M, Farkas T, Morrow AL, et al. Human milk contains elements that block binding of noroviruses to human histo— blood group antigens in saliva. J Infect Dis. 2004;190(10):1850–9.
46. Jumpertz R, Le DS, Turnbaugh PJ, Trinidad C, Bogardus C, Gordon JI, et al. Energy-balance studies reveal associations between gut microbes, 2011;94(1):58–65.
47. Charbonneau MR, O’Donnell D, Blanton LV, Totten SM, Davis JCC, Barratt MJ, et al. Sialylated milk oligosaccharides promote microbiota-dependent growth in models of infant undernutrition. Cell. 2016;164(5):859.
48. Saben JL, Sims CR, Abraham A, Bode L, Andres A. Human Milk Oligosaccharide Concentrations and Infant Intakes Are Associated with Maternal Overweight and Obesity and Predict Infant Growth. Nutrients. 2021;13(2):446.
49. Gridneva Z, Rea A, Tie WJ, Lai CT, Kugananthan S, Ward LC, et al. Carbohydrates in human milk and body composition of term infants during the first 12 months of lactation. Nutrients. 2019;11(7):1472.
50. Puccio G, Alliet P, Cajozzo C, Janssens E, Corsello G, Sprenger N, et al. Effects of infant formula with human milk oligosaccharides on growth and morbidity: a randomized multicenter trial. J Pediatr Gastroenterol Nutr. 2017;64(4):624–31.
51. Marriage BJ, Buck RH, Goehring KC, Oliver JS, Williams JA. Infants fed a lower calorie formula with 2′FL show growth and 2′FL uptake like breastfed infants. J Pediatr Gastroenterol Nutr. 2015;61(6):649–58.