Usual Energy and Nutrient Intakes and Food Sources of Filipino Children Aged 6–12 Years from the 2013 National Nutrition Survey
Usual Energy and Nutrient Intakes and Food Sources of Filipino Children Aged 6–12 Years from the 2013 National Nutrition Survey
Imelda Angeles-Agdeppa, Liya Dinney, and Mario V. Capanzana
It is important to assess the food intake of children aged 6–12 years in order to possibly link this with other nutrition-specific interventions to address malnutrition [1]. This study evaluated usual energy and nutrient intakes and food sources of school-age children in the Philippines. Data were from the 2013 National Nutrition Survey. A total of 6,565 children 6–12 years old from all sampled 8,592 households were interviewed for first-day 24-h dietary recall. A second-day recall was obtained from a random subsample (50% of the children). Usual energy and nutrient intakes were estimated using the PC-SIDE program [2]. Energy inadequacy was compared with estimated energy requirements considering active physical activity. Macronutrients were evaluated using the acceptable macronutrient distribution ranges. Micronutrient inadequacy was computed using the estimated average requirements (EAR) cutoff point method [3].
Results showed that mean energy intake (1,358 kcal) of all children was 24.6% below the estimated energy requirements. Forty-two percent had total fat intake as percentage of total energy below the lower range of acceptable macronutrient distribution ranges (AMDR), and hence most of the energy was provided by carbohydrates (Table 1). About 16% of children had protein intake below the EAR [4]. The mean intakes of total sugar and dietary fiber were 26.8 and 6.9 g/day, respectively (Table 1).
The prevalence of inadequate total fat intake as percent energy intake was especially high in rural areas (60%). In children from the poorest quintile, a higher proportion did not meet the AMDR for total fat (80%), while 14% of the children from the richest quintile exceeded the AMDR. Furthermore, 36% of children from the poorest quintile exceeded the AMDR for carbohydrates (Table 1).
The vitamin with the highest prevalence of inadequacy was vitamin C (81%). Nutrient inadequacy for other vitamins was: folate (70%), riboflavin (67%), and vitamin A (63%), vitamin B6 (30%), niacin (13%), and vitamin B12 (9%). The average intakes of vitamins D and E were 2.2 µg/day and 2.6 mg/day, respectively, and these were very low compared with the recommendations [4]. A high prevalence of inadequacy was also observed for calcium (93%), iron (87%), phosphorus (48%), and zinc (38%). Usual intake of sodium, magnesium, and potassium were 848, 130, and 853 mg/day, respectively. The mean intake of sodium exceeded the requirement, while the intake of potassium and magnesium were below the requirement (Table 1).
Table 1. Mean usual nutrient intake and intake distribution for all children 6–12 years old (n = 6,565)
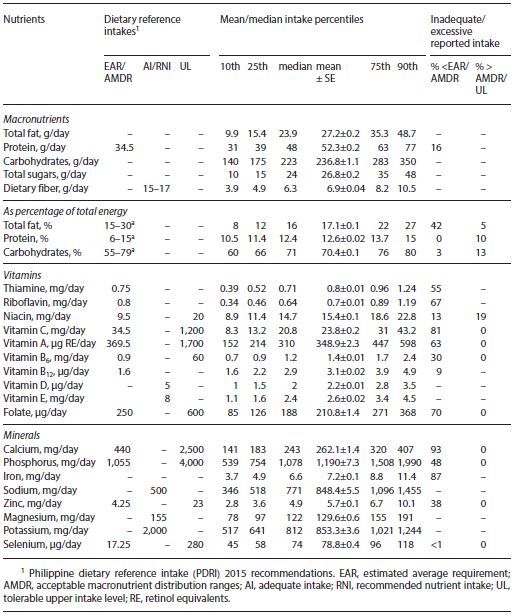
Table 2. Percentage contributions of the top 10 food groups to selected macro- and micronutrient intakes among Filipino school-age children
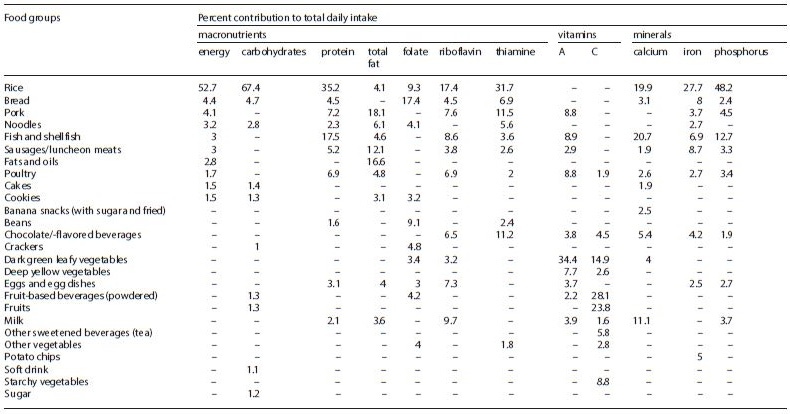
Refined rice is the major source of energy, carbohydrates, and protein providing 53, 67, and 35% of total intake, respectively (Table 2). Rice also contributed a large amount of phosphorous (48%), iron (28%), calcium (20%), thiamine (32%), and riboflavin (17%). Another major contributor of calcium intake was fish and shellfish (21%). The major sources of fats are pork, sausages, and oils. The major source of vitamin C is fortified fruit-based drinks. Dark green leafy vegetables were the major source of vitamin A (34%). Bread was a major source of folate, contributing 17% (Table 2).
Applying usual intake analysis in Filipino children, this study demonstrated that the intakes of fat and many micronutrients were markedly inadequate as evidenced by a high prevalence of inadequate intakes of fat and most vitamins and minerals. The shortfalls in nutrients can be largely explained by the high intake of refined rice, which is the major source of many key nutrients, while nutrient-dense foods such as milk, fruits, and vegetables played little role in the diet. The results are informative to nutrition policy and education both for parents and health care professionals, and could be used for the development of various public health strategies to improve diet quality and address nutrient shortfalls in the diets of this population.
References
- International Food Policy Research Initiative: Global Nutrition Report 2016: From Promise to Impact: Ending Malnutrition by 2030. Washington, International Food Policy Research Institute, 2016, http://www.ifpri.org/publication/ global-nutrition-report-2016-promise-impact-ending-malnutrition-2030.
- Nusser SM, Carriquiry AL, Dodd KW, Fuller WA: A semi-parametric transformation approach to estimating usual daily intake distributions. J Am Stat Assoc 1996;91:1440–1449.
- Lopez-Olmedo N, Carriquiry AL, Rodriguez-Ramirez S, et al: Usual intake of added sugars and saturated fats is high while dietary fiber is low in the Mexican population. J Nutr 2016;146:1856S–1865S.
- Food and Nutrition Research Institute–Department of Science and Technology (FNRI–DOST): Philippine Dietary Reference Intakes (PDRI) 2015. Taguig City, FNRI–DOST, 2015.

Abstract
Usual energy and nutrient intakes and food sources were evaluated in school-aged children in the Philippines using data from the 2013 National Nutrition Survey. A total of 6,565 children 6–12 years old from all sampled 8,592 households were interviewed for a 24-h dietary recall (first day). A second-day recall was obtained from a random sub sample (50% of children). Usual energy and nutrient intakes were estimated using the PC-SIDE program. Energy intake was compared with estimated energy requirements (EER) considering an active activity level. Macronutrients were evaluated using acceptable macronutrient distribution ranges. Micronutrient inadequacies were computed using the estimated aver- age requirement cutoff point method. Mean energy intake was 24.6% below the EER. A high prevalence of nutrient inadequacy was found: protein 16%, thiamine 55%, riboflavin 67%, vitamin C 81%, vitamin A 63%, vitamin B6 30%, vitamin B12 9%, folate 70%, calcium 93%, phosphorous 48%, iron 87%, and zinc 38%. Rice was the major food source of energy (52.7%), carbohydrates (67.4%), and protein (35.2%). Rice also contributed a high proportion of daily phosphorous, calcium, thiamine, riboflavin, and iron. This study demonstrated that intakes of many micronutrients of Filipino school children were markedly inadequate. Refined rice was the major food source of energy and nutrients.
Introduction
Nutritional problems marked by the coexistence of over- and undernutrition leads to serious concerns about increased risk of mortality, illness, and infections, delayed development, cognitive deficits, poorer school performance, and fewer years in school. Because of its impact on child survival and development, which results from international/political and economic crises, malnutrition is very much a significant global problem [1].
Diet is regarded as one of the largest risk factors for the global burden of disease [2]. It is, therefore, important to assess the food intake of the population in order to link this with other nutrition-specific interventions to address malnutrition. Children from 6 to 12 years grow very rapidly and can be very active. They need an adequate intake of energy and a diet that provides all the nutrients needed for growth and cognitive performance [3, 4]. The right amount of energy and nutrients reduces the risk for developing stunting, wasting, as well as overweight and obesity. However, the 2013 National Nutrition Survey (NNS) conducted in the Philippines revealed that a significant number of Filipino children are malnourished. For example, among children 5–10 years old, underweight was 29.1%, stunting 29.9%, and wasting 8.6%. Meanwhile, overweight and obesity were also observed in 9.1% of the children [5].
Studies on the prevalence of inadequate nutrient intake are informative for public health, providing useful data for nutrition diagnosis and for the establishment and monitoring of public policies in nutrition, health, agriculture, and social development [6]. Specifically, nutrient and food intake data are used to track changes and trends in dietary patterns in the population and within population subgroups. These data are also used to assess relationships between food or nutrient intakes and disease; plan nutrition intervention programs; identify the most appropriate foods suitable for fortification; compare food availability among different communities, geographic areas, and socioeconomic groups; and develop national food and nutrition policies, as well as agricultural policies [7].
As such, information on the diet of children in the Philippines is required to identify the magnitude and distribution of inadequate intakes in the population and to develop strategies for prevention and control. The objective of this study is to evaluate usual energy and nutrient in-takes and food sources of school-aged children using data from the 2013 NNS.
Methods
Subjects
The 2013 NNS is a cross-sectional, population-based survey conducted to characterize the health and nutritional status of the Filipino population [5] The survey used a stratified 3-stage sampling system drawn to represent all 17 regions and 80 provinces of the country in both urban and rural areas. A total of 8,592 Filipino households were sampled with a response rate of 91%. Data from 6,565 children aged 6–12 years from the surveyed households were used in the current analysis. Family economic status was assessed by wealth quintiles (poorest, poor, middle, rich, and richest). The wealth status was defined by household possession of vehicles, gadgets, and appliances [5]. The Ethics Committee of the Food and Nutrition Research Institute approved the survey protocol and data collection instruments. All surveyed households provided informed consent prior to participation.
Data Collection
Two nonconsecutive-day 24-h dietary recalls (24hR) were collected to estimate individual food intakes [8, 9]. All members of the sampled households were interviewed to collect data for the first 24hR. For the second 24hR, 50% of randomly selected households with first-day 24hR were interviewed. The 24hR was collected on site through a face-to- face interview by trained registered nutritionist dietitians using a structured questionnaire. The interviewer asked about all foods and beverages that the child consumed on the previous day. In most cases, food items recalled were in a cooked state. Other food items were eaten raw and, therefore, recorded in the raw state.
Quantities were expressed in terms of common household measurements such as cups or tablespoons, or by size and number of pieces, and converted into grams or milliliters for analysis using a list of compiled household food weights and measures or through samples or actual weighing. The weights of foods consumed were converted to as purchased and edible portion values. A computer system called Individual Dietary Evaluation System (IDES) was used to estimate the energy and nutrient content of foods consumed. The IDES is the electronic database of an updated Philippine food composition table where appropriate conversion factors were employed per food items.
Energy and nutrient intakes obtained from IDES were screened to identify implausible values. For the evaluation of energy intake, the ratio of daily energy intake to the estimated energy requirements (EER) was calculated for each person per day and then transformed to the logarithmic scale to remove outliers below –3 SDs and above +3 SDs for each age group [10]. After data editing and processing, 19 individuals were excluded from the analysis, giving a total of 6,546 children for the final analysis. For the evaluation of micronutrient intakes, extreme (very high) intakes were defined as those that exceed- ed 1.5 times the 99th percentile of the observed intake distribution in the corresponding age group. These extreme values were substituted by a random value generated from a uniform distribution in the interval with a lower bound equal to the 95th percentile of observed intake and an upper bound equal to 1.5 times the 99th percentile [10].
Body mass index was calculated as the ratio of weight (in kg) to the square of height (in m2). Weight was measured using mechanical Detecto® platform beam balance scales (Webb City, MO, USA). At least 2 measurements were obtained, with the average re- corded to the nearest 0.1 kg. Standing height was obtained for subjects using the Microtoise – an L-shaped device (head bar) to which a spring-loaded coiled tape measure was attached. At least 2 measurements were obtained, and averages were computed and recorded to the nearest 0.1 cm. For this analysis, only 6,451 children were measured due to nonavailability of some children (114) during the measurement period.
Statistical Analysis
Usual intakes and distributions of energy and nutrients were estimated using the PC- SIDE program from the Iowa State University (version 1.0; 2001) [10]. This program estimates the percentiles of usual nutrient intake distributions as well as the proportion below estimated average requirements (EAR) defined by the Philippine Dietary Reference Intakes 2015 [11]. Hence, the prevalence of inadequacy is estimated as the proportion of individuals with usual intakes below the EAR – EAR cutoff point method [12, 13]. In the PC-SIDE program, it is a requirement that the normality test is accepted in order to generate outputs such as mean, percentile, and adequacy level. In our data, the vitamin C intake distributions for all age groups were highly skewed, which caused rejection of normality. We generated and added a small amount of random noise (N ∼ 0.35, 0.05) to vitamin C intakes to adjust the intakes and reran the analysis [Carriquiry, 2016; oral communication]. For the prevalence of inadequate intakes of iron, a probability approach was used [14]. First, the risk of inadequacy of each individual was computed and then the prevalence of inadequate iron intake, which is the average risk of inadequacy.
Total energy intakes were compared against EER. EER was calculated using the Institute of Medicine equation considering age, sex, body weight, height, and physical activity level for each individual [15]. In this study, we assumed an active physical activity level for Filipino school-age children because most children, especially those in the barrios, walk to school and/or indulge in some outdoor sports or activities.
Adequate intake (AI) and recommended nutrient intake were used to evaluate sodium, potassium, and vitamin D intakes since these nutrients have no EAR. Although it is not applicable to use AI to estimate nutrient inadequacy, if the mean nutrient intake is at or above the AI value for a respective age group, then a low prevalence of inadequate intake can be assumed [11]. Acceptable macronutrient distribution ranges (AMDR) were used to evaluate carbohydrates, total fat, and protein intakes as percentage of energy. Proportions of inadequacy and excessive intakes were classified as less than AMDR lower range and greater than AMDR upper range, respectively [11].
Calculations for summary statistics were carried out using STATA version 13 (Stata- Corp, College Station, TX, USA; 2013). Percent contributions of food groups to energy and nutrient intakes were calculated for selected key nutrients.
Results
Energy and Macronutrients
Means and distributions of energy intake and EER of the children are shown in Table 1. Mean energy intake (1,358 kcal) of all children was 24.6% below the EER (1,780 kcal). Forty-two percent of the children had fat intakes as percentage of total energy below the lower range of AMDR, and hence most of the energy was provided by carbohydrates (Table 2). In addition, 16% of children had protein intakes below the EAR recommended by the Philippine Dietary Reference takes 2015 (Table 2). The mean intakes of total sugar and dietary fiber were 26.8 and 6.9 g/day, respectively.
The prevalence of inadequate total fat intake as percent of energy intake was especially high in rural areas (60%) (Fig. 1). On the other hand, the prevalence of excessive total fat intake was low (5%) but slightly higher in urban areas (8%). Almost all children were within the AMDR for carbohydrate intake (Fig. 1). This was also observed when data were disaggregated by gender and place of residence. In addition, a higher prevalence of excessive carbohydrate intake was seen among children in rural areas (22%). Total fat and carbohydrate intake as percent of total energy was also examined by wealth quintiles (Fig. 1). Children from the poorest quintile had a higher proportion not meeting the AMDR for total fat (80%), while 14% of the children in the richest quintile exceeded the AMDR. Furthermore, 36% of children from the poorest quintile exceeded the AMDR for carbohydrates (Fig. 1).
Vitamins
Inadequate intakes for many vitamins were found. The vitamin with the highest prevalence of inadequacy was vitamin C (81%). Likewise, nutrient inadequacies for other vitamins were also observed: folate (70%), riboflavin (67%), vitamin A (63%), vitamin B6 (30%), niacin (13%), and vitamin B12 (9%). Average intakes of vitamins D and E were 2.2 μg/day and 2.6 mg/day, respectively, and these were very low compared with the AI recommended by Philippine Dietary Reference Intakes 2015 (Table 1).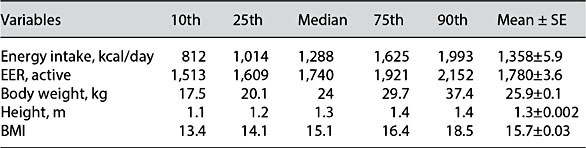 Table 1. Distribution of energy intake and estimated energy requirement (EER) among school-age children from the 2013 National Nutrition Survey (n = 6,553)
Minerals
A high prevalence of inadequacy was also observed for calcium (93%), iron (87%), phosphorus (48%), and zinc (38%) (Table 2). Usual intakes of sodium, magnesium, and potassium were 848, 130, and 853 mg/day, respectively. The mean intake of sodium exceeded the requirement, while the intakes of potassium and magnesium were below the requirement (Table 2).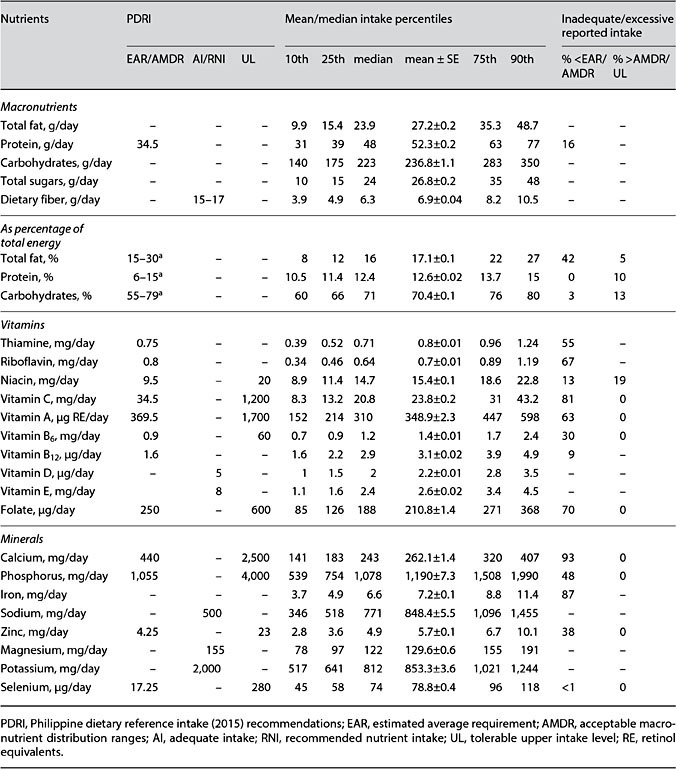
Table 2. Mean usual nutrient intake and intake distribution for all children 6–12 years old (n = 6,565)
Food Sources
Refined rice was the major source of energy, carbohydrates, and protein, providing 53%, 67, and 35% of total daily intake, respectively (Table 3). Rice also contributed a large proportion of daily intakes of phosphorous (48%), iron (28%), calcium (20%), thiamine (32%), and riboflavin (17%). Another major contributor of calcium intake was fish and shellfish (21%). The major sources of fats were pork, sausages (processed meats), and oils. For vitamin C, the major source was from fruit-based beverages (fruit juice drink concentrates and powdered and ready-to-drink fruit juices). Dark green leafy vegetables were the major sources of vitamin A (34%). Bread was a major source of folate, contributing 17%.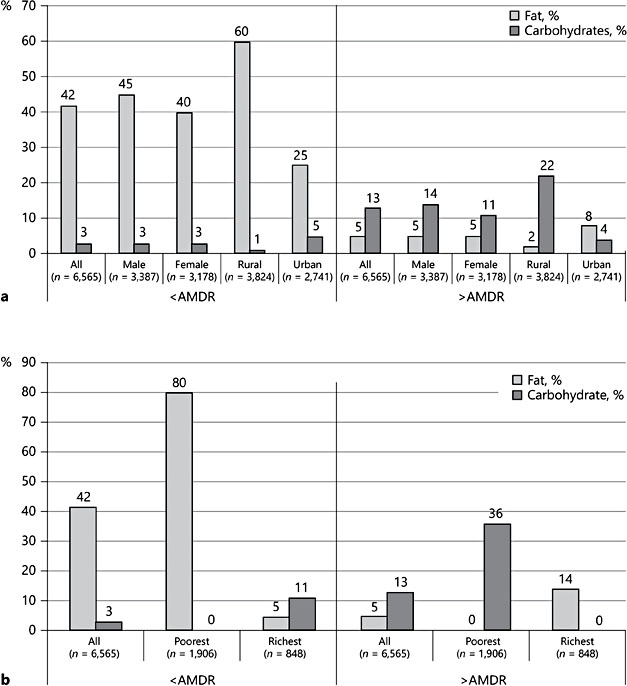
Fig. 1. Percent contribution of fat and carbohydrates to total energy intake of children by gender and place of residence (a) and wealth status (b).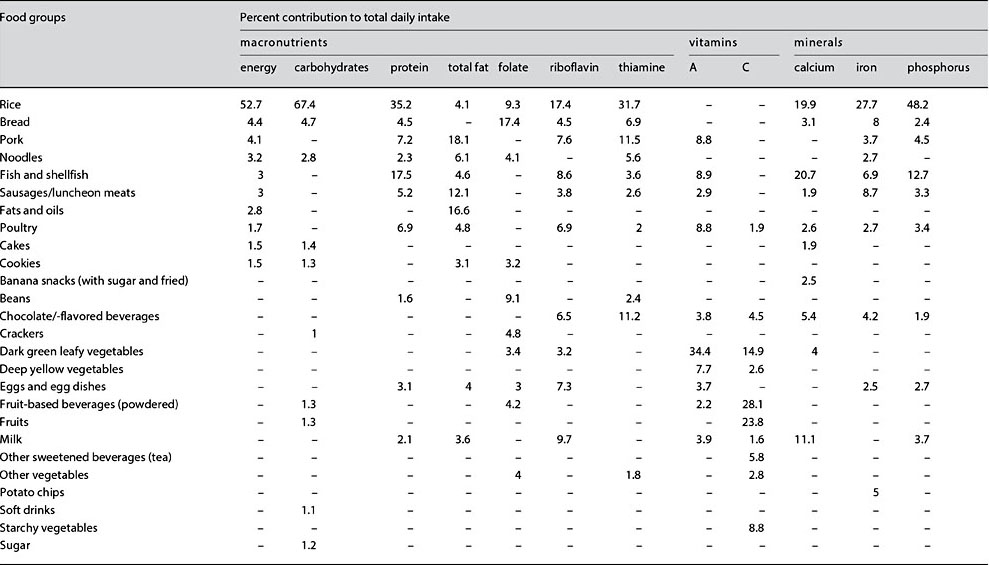
Table 3. Percentage contributions of the top 10 food groups to selected macro- and micronutrient intakes among Filipino school-age children
Discussion
Diet is a determinant factor for malnutrition. Understanding usual nutrient in-takes of specific population groups provides useful data for nutrition diagnosis and for planning nutrition intervention programs. This study evaluated nutrient inadequacies among children aged 6–12 years in the Philippines.
The results showed that there is an alarming problem of nutrient inadequacies among Filipino children. Mean usual energy intake of the children did not meet requirements. Inadequate energy intake may compromise their potential for growth and development, quality of life, and education in school. Most energy in the diet came from carbohydrates, and fat intake did not meet requirements. Fats are needed for growth and development of children, and the extraordinary low intake of fats may impair the absorption of fat-soluble vita- mins. The prevalence of low fat intakes was especially problematic in rural areas and among the poor to poorest wealth quintiles, demonstrating that poor nutrition is both a social and an economic issue. Poverty limits the quantity and quality of dietary intakes [16]. Macronutrient malnutrition may result in wasting and stunting. Indeed, in the 2013 NNS, underweight among children 5–10 years old was 29.1%, stunting 29.9%, and wasting 8.6%. Meanwhile over- weight/obesity (9.1%) was also observed [5]. A study in Kolkata showed that children classified as severely undernourished and children of lower socioeconomic status were found to be “below average” and “well-below average” in motor proficiency categories compared with normal-nourished groups and children of upper socioeconomic status [17]. Stunting represents a loss of potential output for an economy. The calculations of experts suggest that per capita income today is probably 7% higher than it would have been if none of today’s workers had been stunted in childhood. In Africa and South Asia, this “stunting penalty” is likely to be even higher – around 9–10% of GDP per capita [18].
A high prevalence of vitamin and mineral inadequacies was found among the children. A major cause of micronutrient inadequacies is a diet consisting mainly of staple foods, primarily cereals, and lacking animal source foods [19]. In this study, the fact that rice was a major source of thiamine, riboflavin, phosphorous, iron, and calcium showed that indeed the food variety of the children was very low, and nutrient-dense foods were little consumed. Micronutrients are essential to sustain life and for optimal physiological function. The inadequacies of vitamin C, vitamin A, vitamin D, B vitamin, calcium, phosphorous, iron, and zinc intakes may pose significant risks to poor psychosocial development of children consisting of several interdependent domains, including sensory-motor, cognitive, and social-emotional functioning. Micronutrient deficiencies are known to affect these develop- mental processes and functions, resulting in negatively shifting the IQ potential of children [20, 21].
Noteworthy to mention is the alarmingly high prevalence of inadequacy of calcium and vitamin D intakes. Both calcium and vitamin D have important roles in child development and bone growth [22]. A deficiency in either could result in rickets, poor growth, and an increased risk of osteoporosis later in life. Children obtain most of their calcium requirement from milk and cheese, but our study shows that these foods were consumed in minute amounts (data not shown). In a tropical country like the Philippines, supposedly, children can get vitamin D from sunshine; however, we cannot discount the notion that most children spend much of their time indoors.
Fruits and vegetables contributed very low percentages to micronutrient in-takes in the children, indicating that these foods were not sufficiently consumed. Low consumption of fruits and vegetables may result in some health issues in future life, such as cardiovascular disease, some types of cancer, and obesity [23, 24]. Providing a variety of foods from each food group to ensure optimal intake of nutrients is important for school-age children. At this stage, children may face new challenges related to food choices and habits, but decisions on what to eat are largely determined by what is provided in the school and at home. The home food environment is important in the development of children’s dietary behavior [25]. Parents have an important influence on the dietary behavior of children because they generally determine which foods are available at home, and they can set rules about what their children are allowed to eat and act as role models with respect to dietary habits [26].
Conclusions
This study used usual intake analysis to demonstrate that the intakes of fat and many micronutrients in Filipino children are markedly inadequate. The short- falls in nutrient intakes can be largely explained by the fact that refined rice was the major source of many key nutrients while nutrient-dense foods such as milk and vegetables played a minor role in the diet. The results of this study are in- formative to nutrition policy and education, both for parents and health care professionals, and could be used for the development of various public health strategies to improve diet quality and address nutrient shortfalls in the diets of this population.
References
-
1 International Food Policy Research Institute: Global Nutrition Report 2016: From Promise to Impact: Ending Malnutrition by 2030. Washington, International Food Policy Re- search Institute, 2016, http://www.ifpri.org/ publication/global-nutrition-report-2016-promise-impact-ending-malnutrition-2030.
-
2 GBD 2013 Risk Factors Collaborators: Global, regional, and national comparative risk assessment of 79 behavioural, environmental and occupational, and metabolic risks or clusters of risks in 188 countries, 1990–2013: a systematic analysis for the Global Burden of Disease Study 2013. Lancet 2015;386:2287– 2323.
-
3 Hoyland A, Dye L, Lawton CL: A systematic review of the effect of breakfast on the cognitive performance of children and adolescents. Nutr Res Rev 2009;22:220–243.
-
4 Florence MD, Asbridge M, Veugelers PJ: Diet quality and academic performance. J Sch Health 2008;78:209–215.
-
5 Food and Nutrition Research Institute-Department of Science and Technology (FNRI- DOST): Philippine Nutrition Facts and Fig- ures 2013. Taguig City, FNRI-DOST, 2015.
-
6 Guenther PM, Kott PS, Carriquiry AL: Devel- opment of an approach for estimating usual nutrient intake distributions at the population level. J Nutr 1997;127:1106–1112.
-
7 Food and Agriculture Organization, World Health Organization: FAO/WHO Technical Consultation on National Food-Based Dietary Guidelines. Cairo, FAO Regional Office for the Near East, 2006.
-
8 Dodd KW, Guenther PM, Freedman LS, et al: Statistical methods for estimating usual intake of nutrients and foods: a review of the theory. J Am Diet Assoc 2006;106:1640–1650.
-
9 Verly E, Fisberg RM, Marchioni DML: Is the food frequency consumption essential as co- variate to estimate usual intake of episodically consumed foods? Eur J Clin Nutr 2012; 66:1254–1258.
-
10 Lopez-Olmedo N, Carriquiry AL, Rodriguez- Ramirez S, et al: Usual intake of added sugars and saturated fats is high while dietary fiber is low in the Mexican population. J Nutr 2016;146:1856S–1865S.
-
11 Food and Nutrition Research Institute-Department of Science and Technology (FNRI- DOST): Philippine Dietary Reference Intakes 2015. Taguig City, FNRI-DOST, 2015.
-
12 Nusser SM, Carriquiry AL, Dodd KW, et al: A semi-parametric transformation approach to estimating usual daily intake distributions. J Am Stat Assoc 1996;91:1440–1449.
-
13 Carriquiry A: Assessing the prevalence of nutrient inadequacy. Public Health Nutr 1999;2: 23–33.
-
14 National Research Council: Nutrient Adequacy: Assessment Using Food Consumption Surveys. Washington, National Academy Press, 1986.
-
15 Institute of Medicine: Dietary Reference In- takes for Energy, Carbohydrate, Fiber, Fat, Fatty Acids, Cholesterol, Protein, and Amino Acids. Washington, National Academies Press, 2005.
-
16 Horton S, Alderman A, Rivera JA: Copenhagen consensus 2008 challenge paper. Hunger and Malnutrition. Copenhagen Consensus Center, 2008, https://www.copenhagenconsensus.com/sites/default/files/CP_Malnutrition….
-
17 Ghosh S, Ghosh T, Chowdhury S, et al: Factors associated with the development of mo- tor proficiency in school children of Kolakata: a cross-sectional study to assess the role of chronic nutritional and socio-economic status. Dev Psychobiol 2016;58:734–744.
-
18 Galasso E, Wagstaff A, Nadeau S, Shekar M: The Economic Costs of Stunting and How to Reduce Them. Policy Research Note No. 5, Development Economics. Washington, World Bank Group, 2017.
-
19 Bouis HE: Micronutrient fortification of plants through plant breeding: can it improve nutrition in man at low cost? Proc Nutr Soc 2003;62:403–411.
-
20 Wachs TD, Moussa W, Bishry Z, et al: Relations between nutrition and cognitive performance in Egyptian toddlers. Intelligence 1993;17:151–172.
-
21 Morris SS, Cogill B, Uauy R: Effective international action against under nutrition: why has it proven so difficult and what can be done to accelerate progress? Lancet 2008;371: 608–621.
-
22 Bueno AL, Czepielewski MA: The importance for growth of dietary intake of calcium and vitamin D. J Pediatr (Rio J) 2008;84:386– 394.
-
23 Johnsen SP: Intake of fruit and vegetables and risk of stroke: an overview. Curr Opin Clin Nutr Metab Care 2004;7:665–670.
-
24 Cancer Research Fund/American Institute for Cancer: Food, Nutrition, Physical Activity and the Prevention of Cancer: A Global Perspective. Washington, American Institute for Cancer Research, 2007.
-
25 Tinsley B: How children learn to be healthy. Cambridge, Cambridge University Press, 2003.
-
26 Lindsay AC, Sussner KM, Kim J, et al: The role of parents in preventing childhood obesity. Future Child 2006;16:169–186.