Kids Nutrition and Health Study in China
Kids Nutrition and Health Study in China
Dantong Wang
KNHS (the Kids Nutrition and Health Study) is a global research project focusing on the assessment of children’s dietary intakes and eating behaviors, including nutrient intakes, food patterns, and physical activities. China is one of the countries involved in the study. KNHS China is a collaboration between the China National Institute of Nutrition and Health (NINH; Beijing, China), the University of North Carolina (UNC; Chapel Hill, NC, USA), and the Nestlé Research Center (NRC; Lausanne, Switzerland). Data used in this study were from the 2011 China Health and Nutrition Survey (CHNS).
In the 2011 CHNS, a multistage randomized cluster sampling method was used to recruit participants from 9 provinces and 3 mega cities (Beijing, Shanghai, and Chongqing) representing different geographies and economic development stages, with communities from both urban and rural areas. The KNHS China project focused on children 4–13 years old. In total, dietary intake data from 1,481 children in the age range were analyzed. In some publications, the age range was extended from 4–13 to 4–17 years (1,905 subjects) to provide information on a broader age spectrum. Individual dietary data were collected using 24-h recalls on 3 consecutive days (2 weekdays and 1 weekend day). For children younger than 12 years, the mother or a caregiver who handled food preparation and feeding in the household was interviewed. The interviews were conducted by trained field interviewers with the assistance of food models and pictures. Household edible oils, sugar, and salt consumption were determined on a daily basis by calculating the changes in the home food inventory by weighing [1]. Food recalls were coded and analyzed to calculate nutrient intakes using the Chinese Food Composition Tables published in 2009 [2].
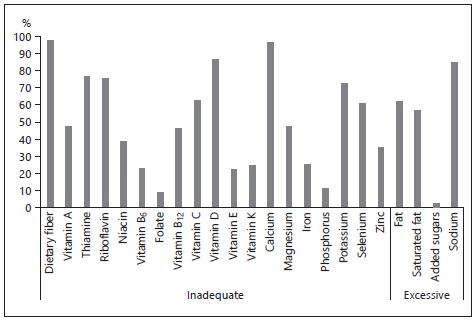
We found that, compared to dietary intake recommendations, Chinese children had low intakes of micronutrients such as calcium and vitamin D. The intake of dietary fiber was low in 97% of children, whereas the intakes of saturated fat and sodium were excessive in 57 and 85% of children, respectively (Fig. 1). Geographic location and socioeconomic status have an impact on food quality and nutrient intakes. Children from urban areas and from higher-income households were more likely to have higher micronutrient intakes and consume more animal source foods, especially dairy products, than those from rural areas and from lower-income households [3]. We observed the double burden of malnutrition in Chinese children: the prevalence of overweight or obesity in children was higher in urban areas and higher-income families than in rural settings and those from lower-income households [4]. The disparity found in this study suggests that specific strategies are needed to improve diet quality and address nutrient shortfalls in different community types.
We also reported that almost all children had 3 main meals, breakfast, lunch, and dinner, and over 70% of them reported having snacks, which contributed 10% of total daily energy. Children 9–13 years old consumed more salty snacks and less fruits and dairy products than children 4–8 years old did, which deserves attention [5]. Promoting healthy food choices in snacking could contribute to the improvement in nutritional quality of the total diet.
In conclusion, the KNHS China results suggest that a comprehensive approach that includes nutrition education, nutrition intervention programs targeting vulnerable populations, and promotion of physical activity inside and outside of school is needed to improve the nutrition and health status of Chinese children.
References
- Zhang B, Zhai FY, Du SF, Popkin BM: The China Health and Nutrition Survey, 1989– 2011. Obes Rev 2014;15(suppl 1):2–7.
- Chinese Nutrition Society: Chinese Dietary Reference Intakes (Edition 2013) (in Chinese). Beijing, Science Press, 2014.
- Zhang J, Wang D, Eldridge AL, et al: Urban-rural disparities in energy intake and contribution of fat and animal source foods in Chinese children aged 4–17 years. Nutrients 2017;9:526.
- Piernas C, Wang D, Du S, et al: The double burden of under- and overnutrition and nutrient adequacy among Chinese preschool and school-aged children in 2009–2011. Eur J Clin Nutr 2015;69:1323–1329.
- Wang D, van der Horst K, Jacquier EF, et al: Snacking patterns in children: a comparison between Australia, China, Mexico, and the US. Nutrients 2018;10:198.
Abstract
The Kids Nutrition and Health Study (KNHS) in China is part of a global research project focusing on the assessment of children’s dietary intakes and eating behaviors. By analyzing data from the 2011 China Health and Nutrition Survey (CHNS), we found that most Chinese children did not consume enough nutrients, such as fiber, calcium, and vitamin D, whereas the intakes of saturated fat and sodium were excessive in 57 and 85% of children, respectively. Children from urban areas and from higher-income households were more likely to have higher micronutrient intakes and consume more animal source foods, especially dairy products, than those from rural areas and from lower-income households. The prevalence of overweight and obesity in children was higher in urban areas and high- er-income families than in rural settings and those from lower-income households. We also reported that almost all children had 3 main meals (breakfast, lunch, and dinner), and 71% of them consumed snacks that contributed 10% of daily energy. Results suggested that a comprehensive approach that includes nutrition education, nutrition intervention programs targeting vulnerable populations, and promotion of physical activity is needed to improve the nutrition and health status in Chinese children.
Introduction
The Kids Nutrition and Health Study (KNHS) is a global research project focusing on the assessment of children’s dietary intakes and eating behaviors, including nutrient intakes, food patterns, and physical activities (PA). China is one of the countries involved in the study. KNHS China is a collaboration between the China National Institute of Nutrition and Health (NINH; Beijing, China), University of North Carolina (UNC; Chapel Hill, NC, USA), and the Nestlé Re- search (NR; Lausanne, Switzerland). Data used in this study were from the 2011 China Health and Nutrition Survey (CHNS). Multiple research articles have been published to communicate the results. The objective of this review is to summarize the key findings of the project and to provide insight for evidence- based decision making to improve the quality of children’s diets and nutrition status in China. Some unpublished data are also included to make the overall China case complete.
Subjects and Dietary Intake: Data Collection
The CHNS is an ongoing longitudinal survey that has been conducted in 1991, 1993, 1997, 2000, 2004, 2006, 2009, and 2011 by China NINH and UNC [1]. Data analyzed in the KNHS China project were from the 2011 survey. In the 2011 CHNS, a multistage randomized cluster sampling method was used to recruit participants from 9 provinces and 3 mega cities (Beijing, Shanghai, and Chongq- ing) representing different geographies and economic development stages, with communities from both urban and rural areas. The KNHS China focused on children 4–13 years old. In total, dietary intake data were analyzed from 1,481 children in the age range. In some publications, the age range was extended from 4–13 to 4–17 years (1,905 subjects) to provide information on a broader age spectrum. The final protocol of the CHNS was approved by the Ethical Review Committee of the China Center for Disease Control and Prevention (No. 201524).
Individual dietary data were collected using 24-h recall methods on 3 consecutive days (2 weekdays and 1 weekend day), including all household members older than 2 years. For children younger than 12 years, the mother or a caregiver who handled food preparation and feeding in the household was interviewed to recall the children’s food consumption. The interviews were conducted by trained field interviewers with the assistance of food models and pictures. Types of foods and beverages, amounts consumed, and types of meals and places of consumption of all food and beverage items consumed in the past 24 h were re- corded. Household edible oil, sugar, and salt consumption were determined on a daily basis by calculating the changes in home food inventory by weighing [1]. Food recalls were coded and analyzed to calculate nutrient intakes using the Chinese Food Composition Tables published in 2009 [2]. In order to estimate the intakes of some important nutrients that are currently missing from the Chinese
Food Composition Table, such as vitamin D and added sugar, the Chinese food codes were linked to US Department of Agriculture (USDA) food codes by a group of experts. The missing nutrient intakes were then imputed using values from the USDA Food and Nutrient Database for Dietary Studies (FNDDS) 2013–2014 [3, 4]. Detailed analysis methods are described in each section below.
Nutrient Intakes in Chinese Children
Dietary intake data were analyzed to assess the nutrient intakes in Chinese children 4–13 years old. The 3-day average intake of each nutrient was compared to Chinese dietary intake recommendations [5]. The estimated average requirement cutoff point method was applied to estimate the proportion of individuals in the group who were at risk of having inadequate micronutrient intakes [6]. In the absence of estimated average requirements, the intake levels were compared to adequate intake. For total and saturated fat, sodium, and added sugar, the percentages of children reported having excessive intakes were also estimated by comparing the average intakes to the upper boundary of the acceptable macro- nutrient distribution range or tolerable upper intake level. We found that >85% of children did not meet the dietary intake recommendations for dietary fiber, calcium, and vitamin D. Over 50% of children had intakes below the recommendations for thiamin, riboflavin, vitamin C, potassium, and selenium. One third of children 4–13 years old fell below zinc intake recommendations. On the other hand, around 60% of children had excessive total and saturated fat intakes, and almost 85% of children consumed too much sodium (Fig. 1).
Usual daily intake is defined as the long-term average daily intake of a nutrient by an individual. The NINH research team calculated the usual daily intakes of some key micronutrients (calcium, sodium, potassium, iron, zinc, selenium, vitamin A, thiamine, riboflavin, and vitamin C) using the mixed-effect model and quantile estimation procedure developed at the National Cancer Institute [7]. The usual intake results confirmed that a significant proportion of children in all age groups had micronutrient intakes below the recommendations, especially for calcium, selenium, riboflavin, and vitamin C [8]. The team also found that the prevalence of inadequate micronutrient intakes was different between children living in urban and rural areas. Children from urban areas had significantly higher intakes of calcium, vitamin D, and zinc than those from rural areas. Children from rural areas and girls were more likely to have low iron intakes compared to urban children and boys, respectively [9].
Thus, the situation of nutrient intakes is still challenging among Chinese children. Greater dietary diversity has been associated with micronutrient status in many studies [10, 11]. To improve micronutrient and fiber intakes, especially in rural areas and girls (for iron), promotion of food diversity and education on healthy food choices combined with targeted nutrition intervention programs could be effective approaches to reduce health risks in Chinese children.
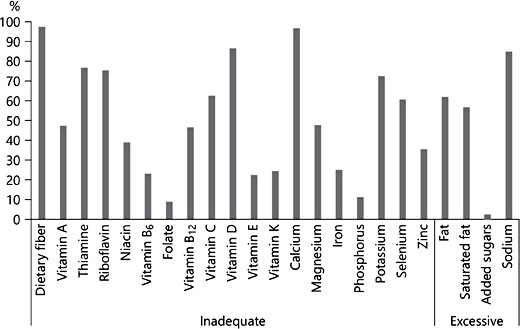
Fig. 1. Percent of Chinese children 4–13 years old with a nutrient intake below or above the recommendation. Inadequate, percent of children with an intake below the estimated average requirement or adequate intake of respective nutrients; excessive, percent of children with an intake above the upper boundary of the acceptable macronutrient distribution range or upper intake level
Energy Intake and Its Food Sources
In China, lifestyle and dietary patterns have changed rapidly as a result of in- creased consumption of a high fat diet, energy-dense foods, and foods of animal origin. As shown in Figure 1, more than half of children had excessive total and saturated fat intakes. We reported the extent to which average daily energy intake (EI) increased with age (from 1,299 kcal/day in 4- to 6-year-olds to 1,529 kcal in 7- to 10-year-olds and 1,746 kcal in 11- to 13-year-olds). The average amount of EI was higher in boys than in girls [12]. As shown in Figure 2, among children 4–13 years old, carbohydrates, proteins, and total fat contributed 53, 14, and 33% of the total daily EI, respectively, and the energy from total fat was higher than the Chinese dietary intake recommendation (20–30%). Moreover, saturated fat provided around 9% EI, which was also higher than the recommended <8% EI limit [5]. Grains, protein foods, fats, and oils were the top energy-contributing food groups which provided 45, 23, and 11% of daily EI, respectively (Fig. 2).
We further investigated the disparities in EI and its food sources in different gender and social economic groups among Chinese children. Meat, poultry, eggs, fish and seafood, milk, and other dairy products were classified as animal source foods. The proportions of energy from animal source foods was 20%; no difference was observed between boys and girls [12]. The communities were categorized into 3 types using an administrative classification based on common socioeconomic features (such as population density, community infrastructure, accessibility to public transport, hospitals, and supermarkets): highly urban (city centers in mega cities), moderately urban (suburban areas of the mega cities and smaller cities), and rural areas. Family income was calculated according to standardized questionnaires. Individuals were divided into tertiles based on their household income per capita. Although the total EI showed no significant disparity, the proportion of energy that came from animal source foods increased with increasing urbanization levels and increasing household income levels. Among the animal food sources, the largest difference was found in the percent consuming of milk and dairy products; it was much higher in highly urban areas (74.4%) than in rural areas (14.8%) [12]. Therefore, given the high prevalence of inadequate calcium intake, leveraging local dietary intake recommendations to promote milk and dairy product consumption in rural areas, to provide nutrients such as calcium, is needed.
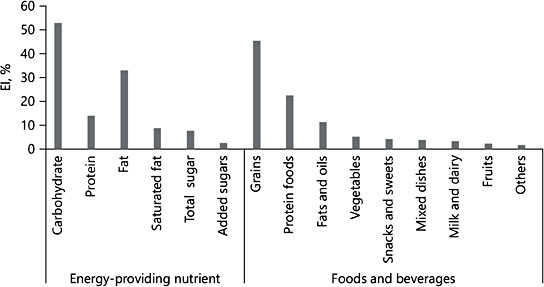
Fig. 2. Percent of energy contribution from each food group in Chinese children 4–13 years old
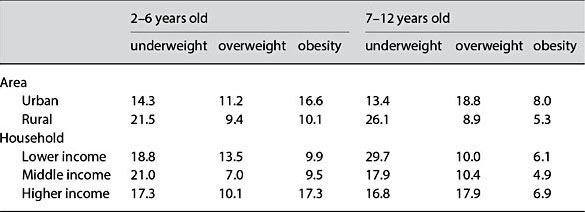
Table 1. Prevalence (%) of underweight, overweight, or obese children by age group and poverty level among Chinese children 2–12 years old [9]
Double Burden of Malnutrition
The double burden of malnutrition refers to the coexistence of under nutrition and overweight and obesity, and it is an important public health issue in China [13]. Piernas et al. [9] studied the body weight status of Chinese children by analyzing data from children 2–12 years old from the 2011 CHNS where the International Obesity Task classification of underweight, normal weight, overweight, and obesity was applied [9, 14]. Results demonstrated the existence of a double burden of malnutrition in Chinese children. The prevalence of underweight was 13–30%, while the prevalence of overweight and obesity were 7–19 and 5–17%, respectively. Children living in urban settings or from higher-income households were more likely to be overweight or obese, while children living in rural settings and those from lower-income households were more likely to be underweight (Table 1) [9]. This aspect needs to be considered in developing nutrition policies.
Meal Consumption and Food Patterns at Breakfast and Snacking
Meal patterns and food consumption are influenced by dietary culture, socioeconomic status, as well as child age. As shown in Table 2, we found that almost all children reported consuming 3 main meals daily: breakfast, lunch, and dinner. Dinner provided the most energy of total daily EI (34%), followed by lunch (31%), breakfast (25%), and snacking (10%). The snacking eating occasion was defined based on self-reporting of any eating occasion outside of the main meals of the day. The prevalence of snacking was 71% in children, which was increased compared to 14% in 1991 and 54% in 2009 [15].
We focused additional research on 2 eating occasions, breakfast and snacking. Su et al. [16] studied breakfast patterns in 4- to 17-year-olds and found that most children (73%) had a home-made breakfast and 83% of them ate at home. Grain foods were the most popular food choice (84%), followed by meat and eggs (32%), fruits and vegetables (24%), and dairy products (including milk) and bean products (24%). Three breakfast patterns were identified by principal component analysis: (1) cereals, vegetables, and fruits (mostly plant origin), (2) dairy products, meat, and eggs (mostly animal origin), and (3) convenience foods (mostly snack foods). The level of community urbanization and household in- come had an influence on breakfast food choice. Children living in highly urbanized communities and those from high-income families were more likely to have dairy, meat, and eggs at breakfast, whereas children living in rural areas and from low-income families were more likely to have cereal, vegetables, and fruits at breakfast. The results suggested that targeted programs are needed to promote a healthy breakfast. On one hand, consumption of fruits and vegetables should be promoted among children living in urban areas and from high-income families; on the other hand, nutrition intervention programs may be needed to help children living in rural areas and from low-income families to include dairy products enriched with calcium and vitamin D in their breakfast.
Snacking is an important eating occasion in children. In China, 71% of 4- to 13-years-old children had snacking occasions, and the most frequently reported snacking frequency was once per day. Snacking contributed 10% daily EI (Ta- ble 2), and it provided disproportionally more dietary fiber, calcium, vitamin C, and vitamin E [17]. Fruits, milk, crackers, yogurt, cakes, and pies were the most frequently reported foods at snacking as well as beverages, which is confirmed by Ouyang et al. [18]. Compared to the 4- to 8-year-old group, the consumption of milk was lower, but consumption of meat and savory snacks was higher among 9- to 13-year-old children [17]. The nutrition quality of snacks is of concern. As part of the total diet, the snacking occasion can contribute to providing a balanced diet. Snacking patterns containing fruits, vegetables, beans, and dairy products should be encouraged. Reducing savory snack consumption and promoting fruit and vegetable consumption are needed across countries, especially among older children.
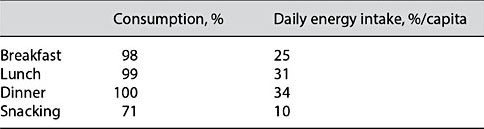
Table 2. Percent consuming one of the meals or snacking and energy contribution at each eating occasion in Chinese children 4–13 years old
Physical Activity
Childhood and adolescence are critical periods to establish healthy behaviors. PA habits formed during this period will affect not only the bones, muscles, and mental development, but also the risk of obesity, hypertension, diabetes, and other related chronic diseases. There are very few reports on PA of Chinese children. In this study, PA was classified as PA at school, outside school, domestic work, travel, and sedentary behavior, and was assessed based on metabolic equivalent hours/week [19]. We found that, among the 5 types of activities listed above, the proportion of children and adolescents with sedentary behaviors was highest (97.9%), and PA outside school was lowest (33.6%). The top 2 median levels of activity were PA outside school and sedentary behaviors (39.9 and 36.1 metabolic equivalent hours/week, respectively), which suggested that the time on sedentary behaviors was long. Children living in urban areas or from higher- income families reported more in-and outside-school PA. But in total, only 49% of Chinese children reached the WHO minimum recommendation on PA. PA needs to be promoted outside of school; meanwhile, existing physical education programs need to be strengthened [16].
Limitation
KNHS China is a cross-sectional study aiming to provide a snap shot of the current nutrition situation in Chinese children; no causal relationships can be inferred. Dietary data were based on self-report. As with other dietary survey data, the potential for underestimation of intakes is a concern. For imputing the missing nutrient values in Chinese food composition tables, such as vitamin D and added sugar, the Chinese food codes were linked to USDA food codes. Although great care was given, due to differences in food grouping methods and local food culture, the risk of misclassification exists.
Conclusion
The nutrition status of Chinese children has improved along with the rapid economic development of the last decades. However, in the KNHS China project, we found that compared with dietary intake recommendations, Chinese children did not consume enough micronutrients, especially for calcium and vita- min D. Iron intake was an issue especially in girls and children living in rural areas. The intake of dietary fibers was low in 97% of children, whereas the intakes of saturated fat and sodium were excessive in 57 and 85% of children, respectively. Geographic location and socioeconomic status have an impact on food quality and nutrient intakes. Children from urban areas and from higher- income households were more likely to have higher micronutrient intakes and consume more animal source foods, especially dairy products, than those from rural areas and from lower income households. We found evidence of the double burden of malnutrition; the prevalence of overweight or obesity in children was higher in urban areas and higher-income families than in rural settings and those from lower-income households, respectively. The disparity found in this study suggests that specific strategies are needed to improve diet quality and address nutrient shortfalls in different community types.
We also reported that almost all children had 3 main meals (breakfast, lunch, and dinner), and over 70% of them reported having snacks that contributed 10% of total daily energy. Children 9–13 years old consumed more salty snacks and less fruits and dairy products than 4- to 8-year-old children did, which deserves attention. Promoting healthy food choices in snacking could contribute to the improvement in nutrition quality of the total diet.
In conclusion, the results from KNHS China suggest that a comprehensive approach that includes nutrition education, nutrition intervention programs targeting vulnerable populations, and promotion of PA inside and outside of school is needed to improve the nutrition and health status in Chinese children.
References
-
1 Zhang B, Zhai FY, Du SF, Popkin BM: The China Health and Nutrition Survey, 1989– 2011. Obes Rev 2014;15(suppl 1):2–7.
-
2 National Institute of Nutrition and Health: Chinese Children and Adolescent Snacking Guidance. Beijing, China Center for Disease Control and Prevention, 2008.
-
3 United States Department of Agriculture and Agricultural Research Service: USDA National Nutrient Database for Standard Reference, Release 26. Beltsville, Nutrient Data Laboratory, 2013.
-
4 United States Department of Agriculture and Agricultural Research Service: What We Eat in America. NHANES 2013–2014. www.ars. usda.gov/nea/bhnrc/fsrg.
-
5 Chinese Nutrition Society: Chinese Dietary Reference Intakes (Edition 2013) (in Chinese). Beijing, Science Press, 2014.
-
6 Murphy SP, Poos MI: Dietary reference intakes: summary of applications in dietary assessment. Public Health Nutr 2002;5:843– 849.
-
7 Tooze JA, Kipnis V, Buckman DW, et al: A mixed-effects model approach for estimating the distribution of usual intake of nutrients: the NCI method. Stat Med 2010;29:2857– 2868.
-
8 Wang H, Wang D, Ouyang Y, et al: Do Chinese children get enough micronutrients? Nutrients 2017;9:E397.
-
9 Piernas C, Wang D, Du S, et al: The double burden of under- and overnutrition and nutrient adequacy among Chinese preschool and school-aged children in 2009–2011. Eur J Clin Nutr 2015;69:1323–1329.
-
10 Steyn NP, Nel J, Labadarios D, et al: Which dietary diversity indicator is best to assess micronutrient adequacy in children 1 to 9 years? Nutrition 2014;30:55–60.
-
11 Allen LH: To what extent can food-based approaches improve micronutrient status? Asia Pac J Clin Nutr 2008;17(suppl 1):103–105.
-
12 Zhang J, Wang D, Eldridge AL, et al: Urban- rural disparities in energy intake and contribution of fat and animal source foods in Chinese children aged 4–17 years. Nutrients 2017;9:526.
-
13 World Health Organization: Double burden of malnutrition. http://www.who.int/nutrition/double-burden-malnutrition/en/ (accessed February 28, 2018).
-
14 Cole TJ, Lobstein T: Extended international (IOTF) body mass index cut-offs for thinness, overweight and obesity. Pediatr Obes 2012;7:284–294.
-
15 Wang Z, Zhai F, Zhang B, Popkin BM: Trends in Chinese snacking behaviors and patterns and the social-demographic role be- tween 1991 and 2009. Asia Pac J Clin Nutr 2012;21:253–262.
-
16 Su C, Wang H, Wang D, et al: The impact of community urbanization and household in- come on breakfast behaviors among Chinese children and adolescents in twelve provinces (in Chinese). Wei Sheng Yan Jiu 2016;45: 882–887.
-
17 Wang D, van der Horst K, Jacquier EF, et al: Snacking patterns in children: A comparison between Australia, China, Mexico, and the US. Nutrients 2018;10:198.
-
18 Ouyang Y, Wang H, Wang D, et al: Snacking food pattern among Chinese children and adolescents in twelve provinces (in Chinese). Wei Sheng Yan Jiu 2016;45:868–875.
-
19 Ng SW, Popkin BM: Time use and physical activity: a shift away from movement across the globe. Obes Rev 2012;13:659–680.