The 2016 Feeding Infants and Toddlers Study: Dietary Intakes and Practices of Children in the United States from Birth to 48 Months


Abstract
FITS (the Feeding Infants and Toddlers Study) 2016 is a national, cross-sectional survey to evaluate the diets and feeding practices of US infants and children <48 months (n = 3,235). Dietary intakes were assessed using 24-h recalls, including a replicate subsample (n = 799), to estimate usual intake distributions and compliance with dietary reference intakes using the National Cancer Institute method. Infant feeding practices and 1-day food group consumption were assessed by age and participation in the Special Supplemental Nutrition Program for Women, Infants, and Children (WIC). Initiation and duration of breastfeeding were higher in 2016 compared to previous FITS surveys. Nutrient intakes of infants were largely adequate, except for vitamins D and E and iron (18% did not meet the iron recommendations at 6–11.9 months). WIC-participating infants were more likely to meet iron recommendations, potentially due to higher use of infant formula. More nutrient inadequacies were noted among toddlers and preschoolers, including low intakes of potassium (12+ months), fiber (12+ months), and vitamins D and E (12+ months), combined with high intakes of sodium and added sugars, especially among WIC participants, and saturated fat among those 24–36 months. These imbalances result from low intakes of vegetables and whole grains, and high intakes of processed meats, sweetened bakery foods, and sugar-sweetened beverages.
Introduction
The United States 2020–2025 Dietary Guidelines for Americans will expand to include recommendations for infants and toddlers (from birth to 24 months, i.e., B-24) for the first time in more than 35 years [1]. Given the very specific nutritional needs of the B-24 age group to support rapid growth and development, as well as the dynamic changes that occur in food consumption patterns, under- standing contemporary dietary patterns and feeding practices is essential not only to inform nutrition policy but also to best tailor clinical and practice guidelines for dietary advice for infants and children [2]. Furthermore, establishing sound dietary patterns in childhood is critical for lifelong health and eating habits [3].
FITS (the Feeding Infants and Toddlers Study) is a periodic nationally representative, cross-sectional survey to collect data on the diets and feeding practices of US infants and young children. FITS was conducted in 2002, 2008, and 2016. The FITS protocol includes extensive data collection on the diets and feeding practices of infants and children (up to 48 months of age), including information on breastfeeding and the use of dietary supplements, and is an ideal data source to inform multiple stakeholders. This chapter summarizes the key findings from FITS 2016 on energy and nutrient intakes,
breastfeeding practices, and food and beverage intakes.
Methods
Complete details of the FITS 2016 survey selection and procedures have been published in great detail previously [4]. Briefly, FITS 2016 has a weighted sampling framework to match United States census in order to make the data nationally representative of the American population from birth to 47.9 months of age. Specific care was employed to have representative participation in the Special Supplemental Nutrition Program for Women, Infants, and Children (WIC), a federally funded program that provides free food packages, nutrition education, and health care referrals to pregnant and postpartum women, infants, and young children from low-income households [5].
A total of 3,235 children under 4 years of age was included in the 2016 survey. For most analyses, age groups were categorized as follows: younger infants (from birth to 5.9 months), older infants (6–11.9 months), toddlers (12–23.9 months), younger preschool- ers (24–36.9 months), and older preschoolers (36–47.9 months); however, breastfeeding and complementary feeding data were also examined by further subdividing the infant age groups. The study protocol and instruments were approved by the Institutional Re- view Boards of RTI International, the University of Minnesota, and the Docking Institute of Public Affairs, Fort Hays State University.
Questionnaires were administered to determine sociodemographic and lifestyle factors and feeding practices, including breastfeeding and introduction of complementary foods. Dietary intake data, inclusive of dietary supplements, were collected from parents or caregivers by trained interviewers using the automated multipass method 24-h dietary recall [6] and the Nutrition Data System for Research (version 2015; University of Minnesota, Minneapolis, MN, USA). A second 24-h dietary recall was collected in a representative subset (n = 799) to estimate total usual intakes and compliance with the dietary reference intake (DRI) guidelines [7] using the National Cancer Institute method [8, 9]. Dietary supplement use was assessed as part of the 24-h dietary recall. Breast milk that was directly fed to a child was not quantified during the dietary recall. Direct breastfeeding volumes are difficult to obtain; volumes were assigned according to existing coding rules established for FITS 2008 [10], informed from the research of Dewey et al. [11, 12] and Kent [13] and supported by a systematic review [14].
All statistical analyses were performed using SAS (version 9; SAS Institute Inc.; Cary, NC, USA) and SAS-callable SUDAAN® (version 11; RTI International; Research Triangle Park, NC, USA) software. Nutrient intakes were compared with DRI data that are available in these age groups, including the estimated average requirement (EAR), adequate intake (AI) in the absence of an established recommended dietary allowance, and the tolerable upper intake level (UL) [7]. The risk of dietary inadequacy is examined by estimating the proportion <EAR of a group, whereas the potential risk for excess is examined by estimating the proportion >UL of a group . In the absence of an EAR, the proportion >AI is an estimate of the adequacy of a group, as no scientific inferences can be drawn from intakes <AI [7, 15]. The DRI includes an acceptable macronutrient distribution range children 12 months and older, and saturated fat is recommended to be
<10% of total energy starting at 24 months. Fiber has an established AI for children 12 months and older.
Results
Dietary Supplements
The use of dietary supplements, almost exclusively vitamin and mineral products, was higher in FITS 2016 than previous surveys, particularly among infants [16, 17]. In 2016, 23% of younger infants and 15% of older infants were reported to use supplements, primarily vitamin D drops. Use of dietary supplements was reported among 21% of toddlers, 35% of younger preschoolers, and 45% of old- er preschoolers. Once children can chew and swallow, products tended to shift from drops to chewable and gummy multivitamins that contain multiple micro- nutrients when compared to infant drops [17]. Nutrient intakes from dietary supplements were included in the usual intake estimates presented below.
Infant Feeding Practices
Initiation and duration of breastfeeding were higher in 2016 compared to previous FITS surveys, but exclusive breastfeeding rates remained below professional and public health objectives [18]. The proportion of infants fed formula was high- er than that of those exclusively fed breast milk in both infant age groups. Exclusive breastfeeding varied by race/ethnicity with significantly lower rates among non-Hispanic black infants (20 and 10%) when compared with non-Hispanic white (40 and 17%) and Hispanic (36 and 14%) infants from birth to 3.9 months and from 4 to 5.9 months, respectively [18]. By the age of 12 months, most children (79%) were not consuming breast milk or formula [17]. Transition from milk-based diets to inclusion of complementary foods is recommended at 6 months of age [19]; a higher proportion of formula-fed (56%) than breastfed infants (25%) were consuming complementary foods at 4–5.9 months of age [18]. At 6 months, most children were consuming complementary foods, and the type and amount of these foods and beverages influence energy and nutrient intakes.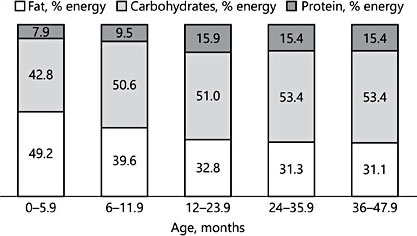
Fig. 1. Distribution of usual energy intakes by age group (data from the FITS 2016 in the USA; n = 3,235)
Dietary Intakes
The distribution of energy from macronutrients showed distinct differences among infants with a higher energy contribution from dietary fats when compared with toddlers and preschoolers, who were remarkably similar (Fig. 1). Energy intakes and diversity of foods and beverages consumed increased with age, as expected, to meet metabolic demands. Beginning at 12 months, few infants exceeded the AI for fiber: 3% among those 12–23.9 months old; 9% among those 24–36.9 months old; and 8% among those 36–47.9 months old. After 24 months, many exceeded the saturated fat recommendations of <10% total energy, including 68% of younger and 63% of older preschoolers.
Nutrients
Nutrients of potential concern based on deviation from DRI identified from FITS 2016 are summarized in Table 1. Nutrient intakes of the youngest infants (<6 months) were largely adequate, with the mean intakes exceeding the AI for all micronutrients (i.e., in more than 80% of infants), except for vitamin D (17%) and vitamin E (35%). In older infants, iron levels were of particular concern with 18% of those 6–11.9 months old below the EAR, but a low prevalence of those exceeding the AI recommendations were also noted for vitamin D (24%) and vitamin E (51%). More than three-quarters of children 12–48 months old have at-risk in- takes for vitamin D, and one-third to one-half had similarly low vitamin E intakes. Concerns exist about excessive intakes of retinol (i.e., preformed vitamin A) and zinc in all groups with an established UL (i.e., 6 months and older), with estimates ranging from 32 to 49% for retinol and from 41 to 69% for zinc (Table 1).
Sodium intakes should track proportionately with energy intakes to remain within the DRI recommendations. Sodium intakes started to exceed calories at around 12 months (∼40% exceeding the UL), and at 24 months more than 70% of preschoolers were exceeding the UL for sodium (Fig. 2). DRI recommendations also suggest that potassium intakes should be near or higher than those of sodium [20], and yet the reverse was apparent among American children starting around 12 months. Beginning at 12 months, few infants exceeded the AI for potassium: 3% among those 12–23.9 months; 6% among those 24–36.9 months; and 4% among those 36–47.9 months.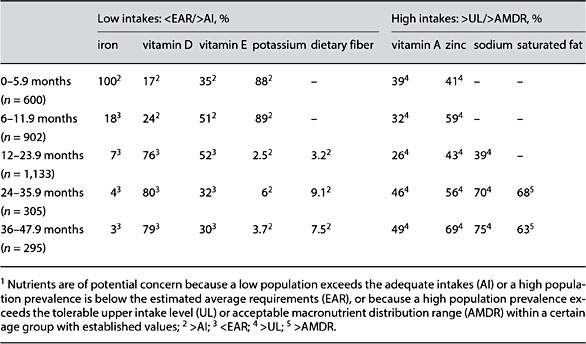
Table 1. Nutrients of potential concern by age group (data from the FITS 2016; n = 3,235)1 (adapted from Bailey et al. [17])
Food and Beverages
The nutrient imbalances noted in FITS 2016 were likely the result from low or high intakes of certain foods and food groups, or from a lack of diversity in the dietary pattern and/or within certain food groups. First, while most toddlers and preschoolers consume adequate grains, many (40%) do not consume any whole-grain foods [21]. Second, close to 20% of toddlers and preschoolers did not consume cow’s milk, an excellent source of vitamin D, potassium, and calcium. Fruit, while consistently consumed across age groups starting at 6 months, is primarily in the form of bananas, apples, and 100% fruit juice; about 20 and 30% of children 12 months and older do not consume any fruit or vegetables on a given day, respectively [18, 21]. The vegetables that are consumed are primarily white fried potatoes [21]. Low potassium intakes could be enhanced by consumption of a variety of vegetables and fruits as well as dairy products (Table 2) [22]. Low iron intakes in older infants were associated with low intakes of fortified infant cereal and meats. Iron-rich infant cereal was consumed by only about one-half of 4- to 12-month-old infants, i.e., less than in previous FITS cycles [18]. Consumption of baby food meat has remained very low (<5%) across time [18].
Mixed dishes are the primary contributor to both sodium and potassium in the diets of American children (Table 3). This is because these foods are the most ubiquitously consumed. Thus, careful attention to reducing sodium sources here may be advantageous. Similarly, high sodium and saturated fat intakes likely result from intakes of processed meats and sweetened bakery foods, respectively.
Added sugar in the diets of American children were primarily coming from sweet bakery foods (i.e., cookies and brownies – also contributing to high saturated fats), sugar-sweetened beverages (excluding 100% fruit juice), and candy and confectionary items. Intakes of added sugars vary by race/ethnicity, particularly for sugary beverages, which were more likely to be consumed among non- Hispanic black children than other race/ethnicity groups [18].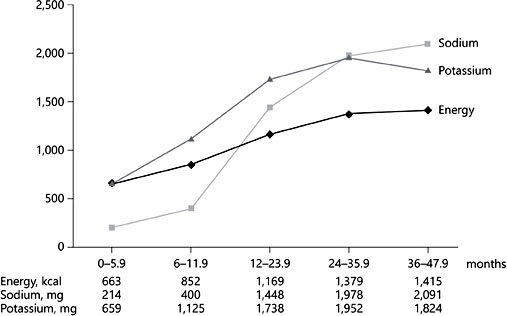
Fig. 2. Mean usual energy, sodium, and potassium intakes by age group (data from the FITS 2016 in the USA: n = 3,235).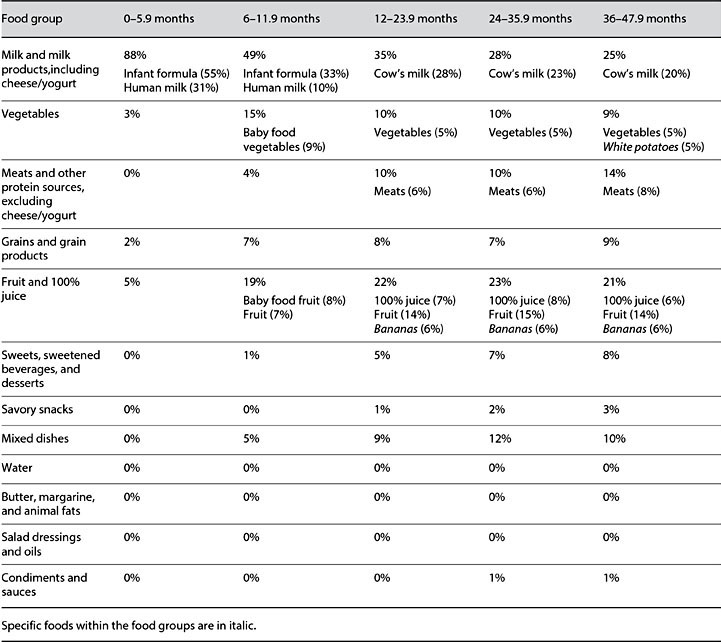
Table 2. Food sources of potassium by age group and contribution (%) from food group and specific foods (data from the FITS 2016 in the USA; n = 3,235)
WIC Summary
WIC provides different food packages to infants and children that are tailored to meet age-specific nutrient needs. Eligibility for WIC is primarily based on income, but many that are income eligible do not participate. Nevertheless, the program reaches about half of infants (51%) and about 30% of children 1–5 years old in the USA [5]. Because program participation is voluntary and only provides a proportion of the total foods and beverages consumed, we can only make associations between participation and dietary exposures.
WIC infants were less likely to be breastfed than higher-income children [23]; however, mean micronutrient intakes were higher for WIC infants possibly due to the fortification and enrichment of infant formula [24]. Our estimates are based on database values of nutrients provided from breast milk and formula, but they do not account for bioavailability. While WIC infants and children appear to have a lower risk of iron inadequacy based exclusively on dietary exposures, we know that iron in breast milk, while lower in amount than in infant formula, is more bioavailable [25]. Thus, more rigorous biochemical assessment of iron status by feeding type is warranted.
WIC provides vitamin-D-fortified milk to children 12 months and older, which may have contributed to a lower risk of inadequate vitamin D intake (%<EAR) than income-eligible nonparticipants. WIC limits milk fat to 2% or less for older children (≥24 months), which may have led to a lower percentage of older children (12–48 months) who participated in WIC exceeding the saturated fat recommendation (<10% of energy intake) compared to both income-eligible and higher-income nonparticipants [24]. High intakes of sodium and added sugars were of concern in all children >12 months, but especially among WIC participants [24].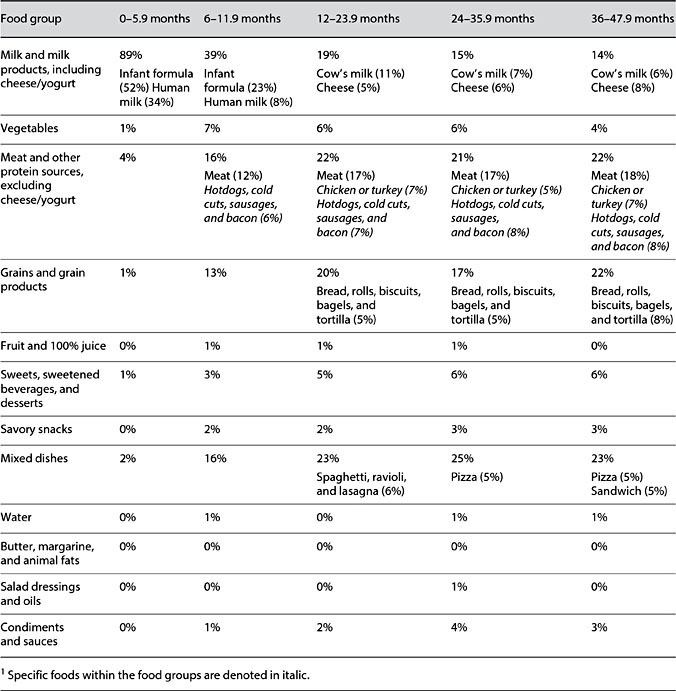
Table 3. Food sources of sodium by age group and contribution (%) from food group and specific foods (data from the FITS 2016 in the USA; n = 3,235)1
Conclusion
The dietary intakes of US infants (<12 months) are nutritionally adequate, with exceptions noted for vitamins D and E, and iron (6–11.9 months); but, many DRI recommendations are limited to the AI in this age group. However, starting at 12 months when children transition from breast milk or formula to family foods and foods outside the home, we observed higher-than-recommended intakes of sodium (12–48 months), added sugars (12+ months), and saturated fat (24–36 months) combined with low intakes of potassium (12+ months), fiber (12+ months), and vitamins D and E (12+ months). Retinol and zinc intakes exceed the UL in more than 25% of participants from 6 months of age. Retinol and zinc in the diets of young children generally come from animal food sources, including milk, foods children this age should be eating. Thus, many researchers question whether the UL are set appropriately for children in these age groups.
Feeding practices should be altered to promote increased intakes of vegetables and whole grains, maintaining adequate intakes of fruit and dairy (or other good sources of nutrients and calcium), while reducing intakes of foods with high sodium and added sugars. Establishing optimal dietary patterns in early childhood is critical not only to support growth and development, but also to promote lifelong health. The FITS 2016 data contribute to our understanding of current feeding practices and nutritional exposures and serve as a foundation to help establish evidence-based feeding recommendations for infants and children.
References
-
1 Raiten DJ, Raghavan R, Porter A, et al: Executive summary: evaluating the evidence base to support the inclusion of infants and children from birth to 24 months of age in the Dietary Guidelines for Americans – “the B-24 Project”. Am J Clin Nutr 2014;99:663S–691S.
-
2 Dwyer JT: The Feeding Infants and Toddlers Study (FITS) 2016: moving forward. J Nutr 2018;148(suppl 3):1575S–1580S.
-
3 Schwartz C, Scholtens PA, Lalanne A, et al: Development of healthy eating habits early in life. Review of recent evidence and selected guidelines.Appetite 2011;57:796–807.
-
4 Anater AS, Catellier DJ, Levine BA, et al: The Feeding Infants and Toddlers Study (FITS) 2016: study design and methods. J Nutr 2018; 148:1516S–1524S.
-
5 Oliveira V: The Food Assistance Landscape: FY 2016 Annual Report. US Department of Agriculture, Economic Research Service, 2017, https://www.ers.usda.gov/webdocs/ publications/82994/eib-169.pdf?v=0.
-
6 Moshfegh AJ, Rhodes DG, Baer DJ, et al: The US Department of Agriculture automated multiple-pass method reduces bias in the col- lection of energy intakes. Am J Clin Nutr 2008;88:324–332.
-
7 Institute of Medicine: DRI Dietary Reference Intakes: Applications in Dietary Assessment. Washington, National Academies Press, 2000.
-
8 Dodd K, Guenther P, Freedman L, et al: Statistical methods for estimating usual intake of nutrients and foods: a review of the theory. J Am Diet Assoc 2006;106:1640–1650.
-
9 Tooze J, Midthune D, Dodd K, et al: A new statistical method for estimating the usual intake of episodically consumed foods with application to their distribution. J Am Diet Assoc 2006;106:1575–1587.
-
10 Devaney B, Kalb L, Briefel R, et al: Feeding Infants and Toddlers Study: overview of the study design. J Am Diet Assoc 2004;104:8–13.
-
11 Dewey KG, Finley DA, Lonnerdal B: Breast milk volume and composition during late lactation (7–20 months). J Pediatr Gastroenterol Nutr 1984;3:713–720.
-
12 Dewey KG, Lonnerdal B: Milk and nutrient intake of breast-fed infants from 1 to 6 months: relation to growth and fatness. J Pediatr Gastroenterol Nutr 1983;2:497–506.
-
13 Kent JC, Mitoulas L, Cox DB, et al: Breast volume and milk production during extend- ed lactation in women. Exp Physiol 1999;84: 435–447.
-
14 da Costa TH, Haisma H, Wells JC, et al: How much human milk do infants consume? Data from 12 countries using a standardized stable isotope methodology. J Nutr 2010;140:2227– 2232.
-
15 Bailey RL, Murphy SP, Weaver CM: Using the Dietary Reference Intakes to Assess In- takes, in Research: Successful Approaches. Chicago, Academy of Nutrition and Dietetics, 2018.
-
16 Butte NF, Fox MK, Briefel RR, et al: Nutrient intakes of US infants, toddlers, and preschoolers meet or exceed dietary reference intakes. J Am Diet Assoc 2010;110:S27–S37.
-
17 Bailey RL, Catellier DJ, Jun S, et al: Total usual nutrient intakes of US children (under 48 months): findings from the Feeding Infants and Toddlers Study (FITS) 2016. J Nutr 2018; 148:1557S–1566S.
-
18 Roess AA, Jacquier EF, Catellier DJ, et al: Food consumption patterns of infants and toddlers with racial/ethnic differences: findings from the Feeding Infants and Toddlers Study (FITS) 2016. J Nutr 2018;148(suppl 3):1525S–1535S.
-
19 American Academy of Pediatrics (Committee on Nutrition). Complementary feeding; in Kleinman R (ed): Pediatric Nutrition Hand- book, ed 5. Elk Grove Village, American Academy of Pediatrics, 2004, chapt 6.
-
20 Institute of Medicine (Food and Nutrition Board): Dietary Reference Intakes for Water, Potassium, Sodium, Chloride, and Sulfate. Washington, National Academies Press, 2005.
-
21 Welker EB, Jacquier EF, Catellier DJ, et al: Room for improvement remains in food consumption patterns of young children aged 2–4 years. J Nutr 2018;148:1536S–1546S.
-
22 Bailey RL, Parker EA, Rhodes DG, et al: Estimating sodium and potassium intakes and their ratio in the American diet: data from the 2011–2012 NHANES. J Nutr 2016;146: 745–750.
-
23 Guthrie JF, Catellier DJ, Jacquier EF, et al: WIC and non-WIC infants and children differ in usage of some WIC-provided foods. J Nutr2018;148(suppl 3):1547S–1556S.
-
24 Jun S, Catellier DJ, Eldridge AL, et al: Usual nutrient intakes from the diets of US children by WIC participation and income: findings from the Feeding Infants and Toddlers Study (FITS) 2016. J Nutr 2018;148:1567S– 1574S.
-
25 Saarinen UM, Siimes MA: Iron absorption from breast milk, cow’s milk, and iron-supplemented formula: an opportunistic use of changes in total body iron determined by hemoglobin, ferritin, and body weight in 132 infants. Pediatr Res 1979;13:143–147.