Babies fed Infant Formula with 2’FL had immune Biomarkers more like breastfed Babies
A new study has found that infants fed formulae supplemented with 2′-fucosyllactose (2ʹFL) had inflammatory cytokine response similar to that of breastfed infants.
Similar to Those Who Are Breastfed, Infants Fed a Formula Containing 2'-Fucosyllactose Have Lower Inflammatory Cytokines in a Randomized Controlled Trial1–4
Abstract
Background: Evidence suggests that human milk oligosaccharides (HMOs) provide multiple benefits to infants, including prebiotic effects, gut maturation, antimicrobial activities, and immune modulation. Clinical intervention studies with HMOs are required to confirm these benefits in infants.
Objective: Our objective was to investigate the effects of feeding formulas supplemented with the HMO 2'-fucosyllactose (2'-FL) on biomarkers of immune function in healthy term infants.
Methods: We performed a substudy nested within a randomized, double-blind, controlled growth and tolerance study in healthy singleton infants (birth weight ≥2490 g) who were enrolled by 5 d of life and exclusively formula-fed (n = 317) or breastfed (n = 107) from enrollment to 4 mo of age. Formula-fed infants were randomly assigned to receive 1 of 3 formulas, all containing 2.4 g total oligosaccharides/L [control: galacto-oligosaccharides (GOS) only; experimental formulas: GOS + 0.2 or 1.0 g 2'-FL/L], and compared with a breastfed reference group. For this substudy, blood samples were drawn from infants at 6 wk of age (n = 31–42/group). Peripheral blood mononuclear cells (PBMCs) were isolated for cellular phenotyping and stimulated ex vivo with phytohemagglutinin for proliferation and cell cycle progression or respiratory syncytial virus (RSV). Cytokine concentrations were measured in plasma and in ex vivo–stimulated culture supernatants.
Results: Breastfed infants and infants fed either of the experimental formulas with 2'-FL were not different but had 29–83% lower concentrations of plasma inflammatory cytokines than did infants fed the control formula [interleukin (IL) receptor antagonist (IL-1ra), IL-1α, IL-1 β, IL-6, and tumor necrosis factor α (TNF-α)] (P ≤ 0.05). In ex vivo RSV–stimulated PBMC cultures, breastfed infants were not different than either of the groups fed formula with 2'-FL, but they had lower concentrations of TNF-α (31%) and interferon γ (IFN-γ; 54%) (P ≤ 0.05) and tended to have lower IL-1ra (25%) and IL-6 (38%) (unadjusted P ≤ 0.05) and IL-1 β (30%) (unadjusted P = 0.06) than did infants fed the control formula.
Conclusions: Our data indicate that infants fed formula supplemented with 2'-FL exhibit lower plasma and ex vivo inflammatory cytokine profiles, similar to those of a breastfed reference group.
Introduction
Breastfeeding provides optimal nutrition for infants. There is considerable evidence that human milk–fed infants have a lower rate of infection than those fed infant formula, suggesting that diet may influence the neonatal immune system (1–4). Preclinical research indicates that human milk oligosaccharides (HMOs)8 enhance gut maturation; act as prebiotics, antiadhesives, and antimicrobials; and directly modulate immune responses; thus, they may play an important role in the protective health effects of breast milk (5, 6).
There are >100 milk oligosaccharides in human milk, and 20 of them are referred to as major HMOs (7). Mature human milk contains 5–15 g oligosaccharides/L, representing the third largest solid component after lactose and lipids, and are present at >100- fold higher concentrations than are found in bovine milk (8, 9). Concentrations of HMOs vary among individuals and over the course of lactation (7, 9–11), the most abundant of which is 2'-fucosyllactose (2'-FL), which ranges from 0.06 to 4.65 g/L (12). Consumed oligosaccharides remain mostly undigested and are found in the feces of breastfed infants at higher concentrations than in maternal milk. These oligosaccharides are also found at low concentrations in the infant's circulation and urine. The profiles of these plasma, urinary, and fecal HMOs resemble that of the infant's mother's milk (10, 13, 14).
In a current study, lacto-N-fucopentaose II (LNF-II), a major HMO, was measured as a representative of the total concentrations of HMOs present in human milk. Higher concentrations of LNF-II in maternal milk at 2 wk postpartum were associated with fewer respiratory problems in infants by 6 and 12 wk of age (15). Current research also suggests that in respiratory syncytial virus (RSV) infection, disease severity is positively correlated with viral load and cytokine profiles in serum, nasal lavage, and in ex vivo–stimulated peripheral blood mononuclear cells (PBMCs) (16–21). These ex vivo PBMC cultures commonly serve as surrogate models of infection and have been shown to be affected by dietary intervention (22).
Because 2'-FL is one of the most abundant components in breast milk and is currently not present in infant formula, we hypothesized that it could play a key role in breast milk's protective effects. To test this hypothesis, we examined healthy term infants fed varying amounts of 2'-FL compared with a reference group of breastfed infants at 6 wk postpartum and analyzed in vivo and ex vivo biomarkers of immune function. We focused our attention on those data that showed existing differences between the ‘‘gold standard’’ [the breastfed (BF) reference group] and the control formula (CF) group that were influenced by the addition of 2'-FL to formula.
Methods
Study design
Original clinical trial. This study is part of a larger study, the design and methods of which have been described previously in detail (23). Briefly, a randomized, double-blind, controlled growth and tolerance study was conducted at 28 sites throughout the United States from April 2013 through January 2014. In brief, healthy infants of singleton birth, with a gestational age of 37–42 wk and a birth weight ≥2490 g, who had exclusively either been fed formula or breastfed since birth, were enrolled by 5 d of life and exclusively formula-fed (n = 317) or breastfed (n = 107) from enrollment to 4 mo of age. Included were infants who were judged to be in good health, as determined from the infant's medical history and parental report, from smoke-free homes, and whose parent or legally authorized representative gave written informed consent. As part of the original clinical trial, infants were randomly assigned to be fed 1 of 3 formulas, all containing a total amount of 2.4 g oligosaccharides/L, according to computer-generated randomization schedules stratified by site and sex prepared by the sponsor. A nonrandomized BF group was also enrolled. The CF contained galacto-oligosaccharides (GOS) only; the experimental formulas (EFs) were fortified with varying amounts of 2'-FL and GOS (CF: 0 g 2'-FL/L + 2.4 g GOS/L; EF1: 0.2 g 2'-FL/L + 2.2 g GOS/L; EF2: 1 g 2'-FL/L + 1.4 g GOS/L). The composition of the study formulas is shown in Table 1. We defined ‘‘exclusively fed’’ as infants who received only their assigned feeding (breast milk or assigned formula) and no other liquids or solids with the exception of drops or syrups consisting of vitamins, mineral supplements, or medicines. Infants who received an alternative feeding on an occasional basis (on less than a total of 5 d) were also considered ‘‘exclusively fed.’’
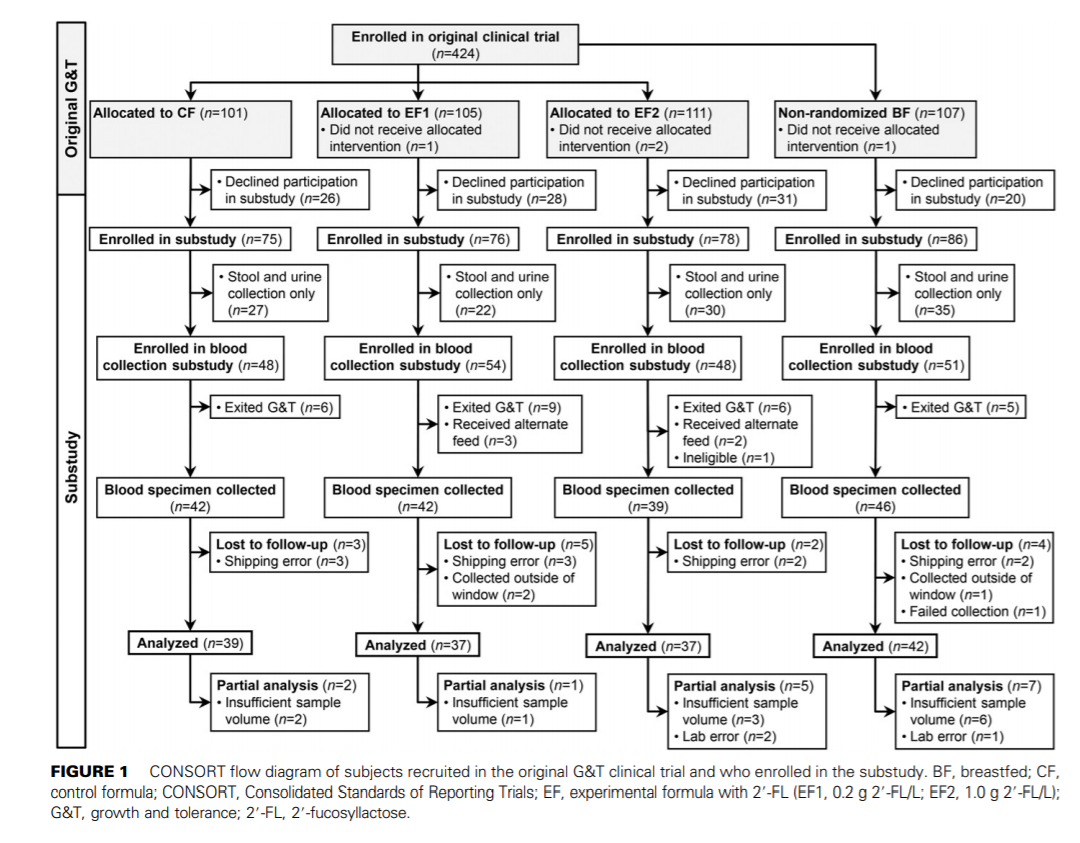
Participant selection for the substudy. Of the 424 infants enrolled in the original clinical trial, all infants whose parent or legally authorized representative agreed to the optional biological sampling, which included the collection of urine, stool, and blood from infants and breast-milk samples from breastfeeding mothers, were included in the substudy (Figure 1). The following criteria were used to determine whether specimens would be collected: from enrollment throughout the study period, formula-fed infants were not to receive >240 mL of an alternate feeding (breast milk or formula other than their assigned study formula or >2 feedings via breast) per week. The breastfed infants were not to receive >240 mL of infant formula or donor milk/wk. For 48 h before the collection of samples, formula-fed infants were not to consume any feedings other than the assigned study formula, and breastfed infants were not to consume any formula or donor milk. If any of these criteria were not met, samples were not collected.
The protocol and all of the study procedures were reviewed and approved by the Schulman Institutional Review Board, Cincinnati, Ohio. This trial was registered at clinicaltrials.gov as NCT01808105.
Concentrations of 2'-FL in plasma, urine, and breast milk have been previously published (23). Stools were analyzed for concentration of IgA, microbiota composition, and characterization of biological factors influential to gastrointestinal health. These data will be presented in a subsequent publication. Data presented here are for the blood cellular phenotyping, ex vivo mitogen-stimulated cell cycle, ex vivo RSV– stimulated cytokines, ex vivo phytohemagglutinin–stimulated cytokines and plasma cytokines.
Sample collection
At 6 wk of age, 2–3 mL nonfasting venous blood was drawn into sodium heparin evacuated tubes with no restriction with regard to time since last feeding. Blood samples were shipped overnight at ambient temperature from the clinical sites to Lovelace Respiratory Research Institute and were processed within 24 h of collection.
Immunologic assays
Isolation of PBMCs and plasma. Plasma was obtained by standard centrifugation procedures, dispensed into small plastic vials, and stored at 280°C until analysis. Blood was reconstituted to original volume with complete Roswell Park Memorial Institute (RPMI) 1640 medium [RPMI-1640 supplemented with 5% FBS, L-glutamine (Mediatech), and antibiotic-antimycotic (Gibco Life Technologies)]. PBMCs were isolated by standard-density gradient centrifugation on Histopaque (Sigma-Aldrich). Viable cells were enumerated by using a hemacytometer.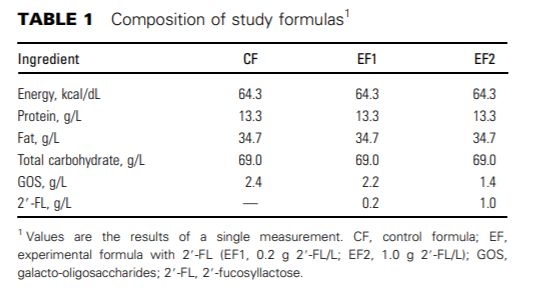
Immunophenotyping. A portion of the PBMCs (0.8 x 10⁶ ) was reserved for baseline phenotyping by flow cytometry (BD FACSCanto). Immunophenotypic analysis was performed by using a panel of fluorescently labeled mouse anti-human monoclonal antibodies to the following cell surface markers: CD4 (fluorescein isothiocyanate, clone L200), CD8 (allophycocyanin-H7, clone SK1), CD20 (phycoerythrin cyanine 7, clone 2H7), and CD56 (phycoerythrin, clone MY31) (BD Biosciences) to identify cell-specific surface antigens. All antibodies were used at concentrations recommended by the manufacturer and mixed with 400,000 PBMCs. PBMCs were initially treated with a 1/20 dilution of Human FcX (Biolegend, Inc.) to block Fc receptors before the addition of fluoresceinated antibodies. Incubation proceeded on ice for 20 min before 1 wash in stain buffer (13 Dulbecco's PBS containing 3% FBS and 0.1% sodium azide) and fixation with 1% formaldehyde in stain buffer.
Samples were acquired by using the BD FACSCanto and BD FACSDiva software (Becton Dickinson Immunocytometry Systems). Anti-mouse Ig beads were stained individually with each fluoresceinated antibody to serve as compensation controls (anti-mouse Ig, k; Compbead Plus, 7.5 µM; BD Biosciences). For the discrimination of CD4+ T cells, CD8+ T cells, CD20+ B cells, and CD56+ NK cells, ≥8000 mononuclear cells were collected (from a target of 40,000 total events), and results are expressed as a percentage of the total live, mononuclear single cells gated on the basis of forward- and side-scatter.
Cell culture
PBMCs were resuspended at 5.0 3 106 cells/mL in 0.2 mL 5% FBS/ RPMI-1640 medium. Cytokine secretion and RSV nonstructural protein 1 (NS1) viral load analyses were evaluated by using a modification of Douville et al. (24). Briefly, cells were incubated in 12- 3 75-mm sterile polypropylene tubes and stimulated with either RSV strain NM232 (New Mexico Department of Health clinical isolate NM232) at a multiplicity of infection of 1.0 or media. The virus was allowed to adsorb for 1 h at 37°C with 5% carbon dioxide before dilution of the cells to 1 x 10⁶ /mL and further incubation for 47 additional hours. Supernatants were thereafter harvested by centrifugation, treated with a 1% volume of protease inhibitor cocktail (no. 11-6970498-001; Roche Diagnostics), and frozen at -80°C until cytokine analyses. One milliliter of TRIzol Reagent (Ambion/RNA, no. 15596018; Life Technologies) was added to the remaining cell pellet and frozen at -80°C until RNA extraction.
For proliferation and cell cycle analysis, cells were resuspended in complete RPMI-1640 media supplemented with 10% FBS, seeded into 48-well culture plates (400,000/well), and stimulated in duplicate with either phytohemagglutinin at a final concentration of 5 µg/mL or left unstimulated. Cells (200-µL final volume/well) were incubated at 37°C with 5% carbon dioxide for 48 h. Supernatants were harvested by centrifugation and frozen at -80°C until cytokine analyses. The 48-h incubation period was chosen on the basis of previous literature (25–28) and optimization experiments conducted before the study showing nearmaximal production of most cytokines.
Cytokine secretion assays
Plasma and cell supernatants from PBMC cultures were thawed and analyzed for cytokines by using a commercially available multiplex kit (HCYTOMAG-60K-10, custom 10 analyte; EMD Millipore) by using the manufacturer's protocol. As provided by the manufacturer, the intra- and interassay CVs for the various cytokines were ≤3.3% and
≤18.3%, respectively. The lower limits of detection ranges for the individual assays are as follows: IFN-α2, 0.67–4.16 pg/mL; IFN-γ, 0.46–4.1 pg/mL; IL-10, 0.02–2.84 pg/mL; IL-1 receptor antagonist (IL-1ra), 0.05– 3.68 pg/mL; IL-1α, 0.0–2.91 pg/mL; IL-1β, 0.62–3.17 pg/mL; IL-6, 0.33–4.22 pg/mL; IFN-γ–induced protein 10 (IP-10), 0.68– 4.72 pg/mL; regulated upon activation, normal T cell expressed and secreted (RANTES), 0.76–3.37 pg/mL; and TNF-α, 0.71–4.08 pg/mL. For each assay, values below the limit of detection were imputed with the limit of detection for that assay divided by 2.
Lymphocyte proliferation and cell cycle assay
Bromodeoxyuridine was added to proliferation culture wells set up in parallel 47-h postincubation; 1 h later, the cells were harvested and stained with fluoresceinated antibodies to cell surface markers CD4, CD8, CD20, and CD56 as described above. Cells were fixed, permeabilized, and treated with DNAse to expose bromodeoxyuridine epitopes and stained with anti–bromodeoxyuridine-allophycocyanin antibody according to kit instructions (allophycocyanin-bromodeoxyuridine proliferation kit, no. 557892; BD Pharmingen) at room temperature for 20 min (29). Cells were washed, and kit-supplied 7-aminoactinomycin D (20 µL) was added to each cell pellet, followed by 400 µL stain buffer. Cells were acquired on the BD FACSCanto, as described above, with relevant compensation controls. CD4+ T cells, CD8+ T cells, CD20+ B cells, and CD56+ NK cells in sub-G0/G1 (apoptotic), G0/1, S, and G2/M phases after media only or phytohemagglutinin stimulation were determined and expressed as a percentage of live singlet cells.
PCR
Total RNA was extracted from PBMCs by using the Direct-zol RNA miniPrep kit (Zymo Research Corporation), according to the manufacturer's instructions. Total RNA was then quantified via absorbance at 260 nm, and RNA integrity was checked by using the Agilent Bioanalyzer. Total RNA was then used as a template to detect an RSVspecific gene product NS1 to quantify viral load (30) by using TaqMan One-Step qRT-PCR kits (Applied Biosystems) according to the manufacturer's protocol.
Statistical analyses
This original clinical trial was a prospective, randomized, multicenter, double-blinded, 4-arm parallel study to compare the growth and tolerance of healthy term infants fed EFs containing 2'-FL with a CF and breast milk. A sample size of 64 subjects in each formula feeding group was calculated for the primary outcome (growth) by using the software package nQuery Advisor 5.0 (Statistical Solutions Ltd.), as previously described (23). With an assumed attrition rate of 30%, target enrollment was ~92 subjects/formula feeding group. Additional subjects were enrolled to achieve complete laboratory samples from a minimum of 30 subjects/group. No power analysis was conducted for the substudy. Families and clinical sites were not blinded to the BF reference group but were blinded to the formula treatment allocation. Laboratory personnel and statisticians were blinded to all groups until after all of the analyses were completed. The statistical plan and complete statistical analysis were performed before unblinding.
Data are expressed as means ± SEMs. Statistical analyses for plasma cytokines, viral load, and baseline characteristics were conducted by using GraphPad Prism 6.02. SAS version 9.2 was used to perform all other analyses. For continuous variables, normal distributions of the data were determined by the Shapiro-Wilk test. Comparisons were made between the 4 groups of normally distributed data by 1-factor ANOVA (treatment group and site included in the model). For nonnormally distributed data, square root or log-transformations (for nonnegative data) and/or outlier removal were attempted to improve model fit. If these were unsuccessful, then nonparametric analyses (Kruskal-Wallis and Wilcoxon's rank-sum test) were performed. If there was a significant effect, multiple-comparison tests were performed between each pair of treatment groups, with corrections for multiple testing. For plasma cytokines and viral load, pairwise comparisons were performed by using Fisher's least significant difference (Holm-Sidak's or Dunn's correction). All other pairwise comparisons of continuous variables were performed by using least-squares means (step-down Bonferroni adjustment). Categorical variables were compared between groups by using chisquare followed by Fisher's exact tests and adjusted for multiple comparisons (step-down Bonferroni adjustment). Although multiplecomparison adjustments were made, unadjusted P values were used to
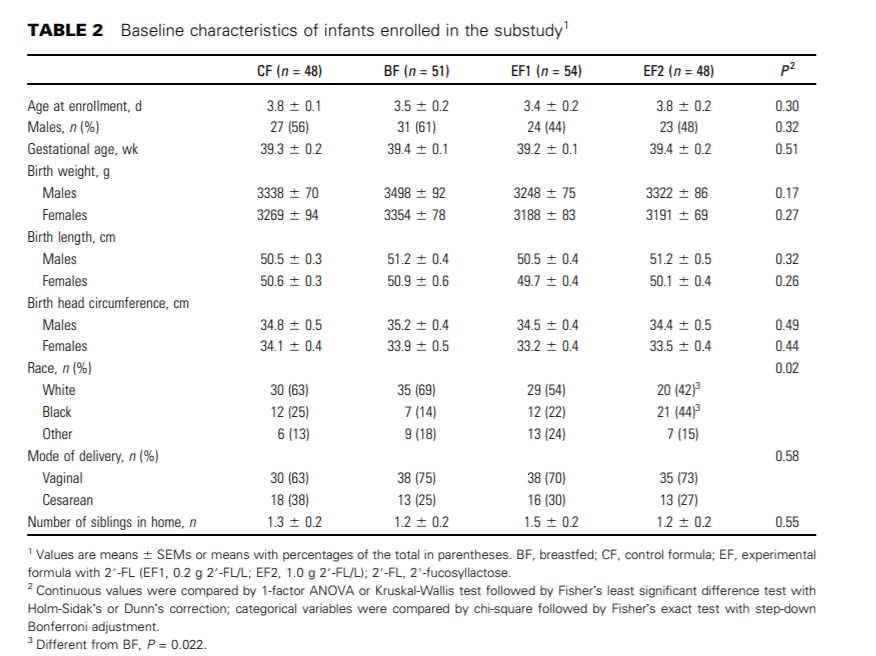
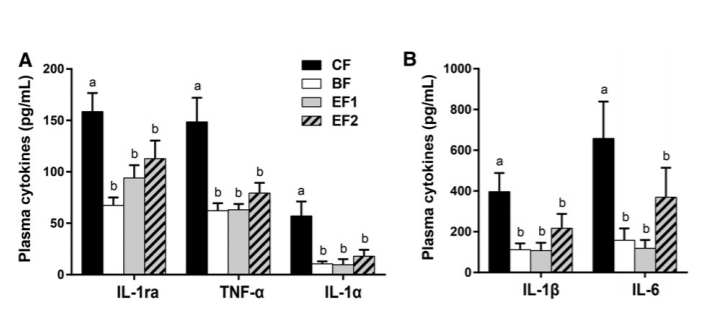
FIGURE 2 Plasma cytokine concentrations in 6-wk-old infants who were exclusively breastfed or fed GOS-containing CF alone or with 0.2 or 1.0 g 2'-FL/L from 5 d until 4 mo of age (panels A and B differ in magnitudes of secretion). Values are means ± SEMs; CF, n = 39; BF, n = 42; EF1, n = 37; EF2, n = 37. Labeled means without a common letter differ, P ≤ 0.05 (1-factor ANOVA or Kruskal-Wallis test followed by Fisher's least significant difference test with Holm-Sidak's or Dunn's correction). BF, breastfed; CF, control formula; EF, experimental formula with 2'-FL (EF1, 0.2 g 2'-FL/L; EF2, 1.0 g 2'-FL/L); GOS, galacto-oligosaccharides; IL-1ra, IL-1 receptor antagonist; 2'-FL, 2'-fucosyllactose.
identify trends and to generate and refine hypotheses. Significance was set at P ≤ 0.05, and trends were set as P ≤ 0.10. All reported P values were adjusted unless otherwise indicated.
Results
Participant characteristics. There were no significant differences between feeding groups for age at enrollment, sex, weight, length, or head circumference at birth. There was a significant difference between the EF2 and BF groups with respect to race, with the BF group composed of more infants who were white and the EF2 group composed of more infants who were black (Table 2). In the original study, 9 of the total 424 subjects violated the criteria of ‘‘exclusively fed’’ (1 CF, 3 EF1, 1 EF2, and 4 BF). These numbers did not affect the mean birth weights of any of the groups.
Inflammatory cytokine profiles. Circulating plasma concentrations of inflammatory cytokines IL-1α, IL-1β, IL-6, and TNF-α and anti-inflammatory IL-1ra were significantly higher (82%, 72%, 76%, 58%, and 58%, respectively) in the CF group than in the BF group (P ≤ 0.05) (Figure 2). Both the EF1 and EF2 groups exhibited profiles that were significantly different from the CF group and not different from the BF group or from each other. There were no differences in plasma cytokines IFN-α2, IFN-γ, IL-10, IP-10, or RANTES between any of the groups (Supplemental Table 1).
In ex vivo RSV–induced PBMC culture supernatants, both TNF-α and IFN-γ were significantly higher in the CF group than in the BF group (31% and 54%, respectively; P ≤ 0.05) (Figure 3). Similar trends were shown with IL-1ra (25%) and IL-6 (38%) (unadjusted P ≤ 0.05) and IL-β (30%; unadjusted P = 0.06).
Neither of the 2'-FL–supplemented groups differed significantly from the BF group or from each other for any of the cytokines tested. The EF1 group had lower concentrations than the CF group of IL-1β (71%; P ≤ 0.05) and of TNF-α (58%) and IL-6 (48%) (unadjusted P ≤ 0.05), but not of IL-1ra or IFN-γ. EF2 did not differ from CF for any of the ex vivo cytokines. RSV-induced IFN-α2, IL-1α, IL-10, IP-10, and RANTES did not differ significantly between the dietary groups (Supplemental Table 1).
No significant differences between the CF and BF groups were found in cytokine production in supernatants from phytohemagglutinin-stimulated PBMCs. There was a significant difference for IP-10 (P ≤ 0.05) between the EF1 and EF2 groups only (Supplemental Table 1).
Circulating lymphocyte populations.
The CF group had significantly lower percentages of circulating T lymphocytes than the BF group for total T cell (37.8% compared with 45.8%) and CD8+ (14.4% compared with 18.4%) (P ≤ 0.05; Figure 4), and trended lower for CD4+ (23.3% compared with 27.4%; P = 0.06). No significant differences were observed in any cell type between the 2'-FL–supplemented groups and the CF or BF groups, with the exception of CD8+ cells, which were lower in the EF2 group than in the BF group (15.1% compared with 18.4%; P ≤ 0.05; Figure 4).
Immune cell proliferation and cell cycle analysis.
In phytohemagglutinin-activated PBMCs, the CF group did not differ significantly in the percentage distribution of cells in the G0/1, S, and G2/M phases of the cell cycle or in the mean proliferative indexes compared with the BF group, with the exception of increased CD20+ cells in the S phase (2.18%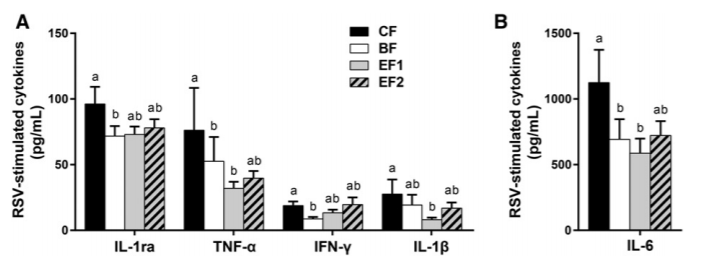
FIGURE 3 Ex vivo cytokine production by RSV-stimulated PBMCs from 6-wk-old infants who were exclusively breastfed or fed GOS-containing CF alone or with 0.2 or 1.0 g 2'-FL/L from 5 d until 4 mo of age (panels A and B differ in magnitudes of secretion). Values are means ± SEMs; CF, n = 37; BF, n = 36; EF1, n = 36; EF2, n = 34. Labeled means without a common letter indicate a trend difference, unadjusted P ≤ 0.05 (1-factor ANOVA or Kruskal-Wallis and Wilcoxons rank-sum test without correction). BF, breastfed; CF, control formula; EF, experimental formula with 2'-FL (EF1, 0.2 g 2'-FL/L; EF2, 1.0 g 2'-FL/L); GOS, galacto-oligosaccharides; IL-1ra, IL-1 receptor antagonist; PBMC, peripheral blood mononuclear cell; RSV, respiratory syncytial virus; 2'-FL, 2'-fucosyllactose.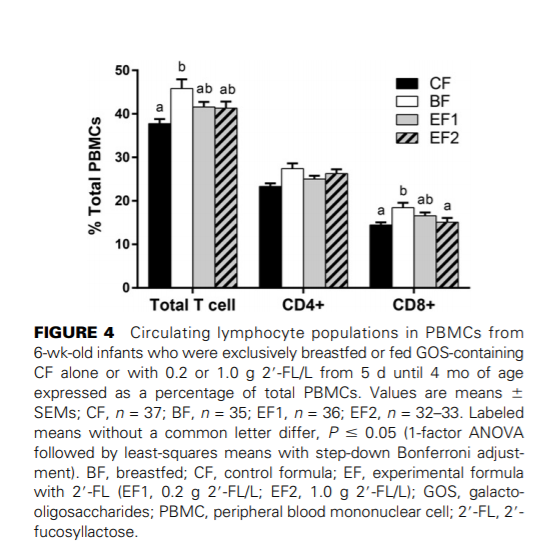
compared with 1.26%; P ≤ 0.05). The BF group had more CD8LoCD4-cells in the G2/M phase than did the EF2 group (0.128% compared with 0.068%; P ≤ 0.05) (Supplemental Table 1).
Although not significant, the percentages of cells in the subG0/G1 (apoptotic) phase of the cell cycle trended lower in the CF group than in the BF group for total T cells (0.521% compared with 1.03%) and CD8+ T cells (0.251% compared with 0.488%) (unadjusted P = 0.07 and 0.04, respectively). CD8 cell subpopulations also showed similar trends (unadjusted P values: CD8Hi CD4Lo, P = 0.08; CD8Hi CD42, P = 0.02; CD8Lo CD4+, P = 0.08; and CD8Lo CD42, P = 0.06) (Figure 5). The EF1 group was not different from the BF group for any cell type but was higher than the CF group for the CD8Hi CD4Lo subset (unadjusted P = 0.05). The EF1 group also had a greater percentage of sub-G0/G1 CD56+ cells (0.034% compared with 0.010%; P ≤ 0.05) than the CF group (Supplemental Table 2). There were no differences between CD4+ or CD20+ cells in the percentage of cells undergoing apoptosis (Supplemental Table 2).
RSV viral load. There were no differences between any of the groups for RSV NS1 viral load (Supplemental Table 1).
Discussion
This is the first study, to our knowledge, to investigate whether feeding 2'-FL in the matrix of infant formula affects the developing immune system. We looked at plasma cytokine concentrations, cytokines released by ex vivo stimulation of PBMCs, and percentages of major lymphocyte subsets within the PBMC population as biomarkers of immune function.
Cytokines are cell-signaling molecules that regulate both the innate and adaptive immune responses and guide the differentiation and development of immune cells. Specific in vivo and ex vivo innate cytokines were found to differ between breastfed infants and infants fed CF. Cytokines affected by diet were primarily derived from antigen-presenting cells (i.e., dendritic cells, monocytes and macrophages). Similar in vivo cytokine differences between breastfed and formula-fed infants have been reported among primarily allergy-prone infants through the first year of life (31). We found that infants fed 2'-FL–fortified formulas exhibited innate cytokine profiles that were intermediate between breastfed and CF infants and more like breastfed infants. Interestingly, the higher dose of 2'-FL (1 g/L) was not more effective than the lower dose of 2'-FL (0.2 g/L) in modulating cytokine profiles relative to breastfed infants. Nonlinear dose-dependency of immune responses has been reported among infants fed formulas containing nucleotides (32) or osteopontin (33), whereby higher concentrations of immuneregulating ingredients were not more effective than lower doses. Receptor-mediated signaling systems often exhibit nonlinear dose-response behaviors, sometimes with ‘‘all or none’’ responses over a narrow range of concentrations (34). Effective dose plateaus have been observed with other dietary ingredients, such as cocoa flavanols (35) and chitosan oligosaccharides (36), in modulating inflammatory responses. This could be due to receptor saturation or functional antagonism of signaling pathways, among others. Pharmacodynamic studies would be required to establish the precise 2'-FL interactions involved.
We observed no differences between groups in cytokine production or cellular proliferation in phytohemagglutin instimulated PBMCs. Albers et al. (37) suggested that some standard assessments of immune function may saturate the response, and thus be insensitive to the modest changes due to nutrition. They suggested that modifying procedures to use suboptimal stimulation conditions may increase the sensitivity in order to detect subtle modulatory effects, but caution that such modifications are not yet sufficiently standardized to allow comparisons between different laboratories. There are several possible explanations for our observed 2'-FL–mediated anti-inflammatory effects. Wickramasinghe
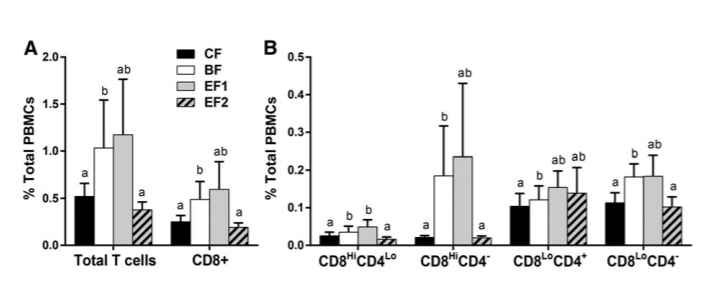
FIGURE 5 Percentages of phytohemagglutinin-stimulated T cells undergoing apoptosis (sub-G0/G1) after 48 h from 6-wk-old infants who were exclusively breastfed or fed GOS-containing CF alone or with 0.2 or 1.0 g 2'-FL/L from 5 d until 4 mo of age expressed as a percentage of total PBMCs (panels A and B differ in magnitudes). Values are means ± SEMs; CF, n = 37; BF, n = 34; EF1, n = 36; EF2, n = 32. Labeled means without a common letter indicate a trend difference, unadjusted P ≤ 0.10 (Kruskal-Wallis and Wilcoxon's rank-sum test without correction). BF, breastfed; CF, control formula; EF, experimental formula with 2'-FL (EF1, 0.2 g 2'-FL/L; EF2, 1.0 g 2'-FL/L); GOS, galacto-oligosaccharides; PBMC, peripheral blood mononuclear cell; 2'-FL, 2'-fucosyllactose.
et al. (38) showed that Bifidobacteria grown with HMOs as the sole carbon source led to reduced expression of inflammatory genes in colonic epithelial cells. In addition, in models of both mature and immature intestinal epithelial cells, 2'-FL was shown to decrease CD14 expression and to increase the relative amounts of negative regulatory molecules while repressing NF-kβ pathways, thus blocking inflammatory cytokine production (39). In our study, we previously reported that 2'-FL is present in the circulation of breastfed infants and infants fed 2'-FL– fortified formulas, with a similar rate of uptake among groups (23). Because 2'-FL is known to bind to dendritic cell-specific intercellular adhesion molecule-3-grabbing non-integrin (DCSIGN) (40), a glycan-binding protein expressed on antigenpresenting cells, it is conceivable that 2'-FL regulates innate immune responses through interactions with DC-SIGN, thus dampening inflammatory cytokine production.
With respect to adaptive immunity, we found that 2'-FL narrowed the differences in proportions of total T lymphocytes (including helper T cells and cytotoxic T cells) between breastfed and CF-fed infants. In addition, 2'-FL narrowed the differences in the percentages of apoptotic cells between BF and CF groups, in particular with CD8+ T cells and CD8+ T cell subsets. Apoptosis is a normal physiologic process that is important in the maintenance of cellular homeostasis and the regulation of the immune response. Daigneault et al. (41) reported that monocytes play a role in the induction of apoptosis in activated T cells. T cells enhance inflammatory cytokine production by monocytes through the release of IFN-γ. In our study 2'-FL increased the percentages of activated CD8+ T cells undergoing apoptosis more like in the breastfed infants. The removal of activated T cells via apoptosis could serve to downregulate the inflammatory cytokine expression by both the T cells and the resulting activated monocytes.
As previously reported (23), the CF group had a significantly higher percentage of subjects (n = 5) with reported eczema than did the EF1 and EF2 groups which had none with eczema (P ≤ 0.05). The role of inflammatory cytokines IL-1α, IL-1β, TNF-α, and IL-6 in the disruption of the skin barrier and ensuing dermatitis has been well documented (42, 43). Moro et al. (44) reported prebiotic oligosaccharides to reduce the incidence of atopic dermatitis during the first 6 mo of age and speculated that part of the observed effects could be due to the interaction of prebiotics with carbohydrate receptors on immune cells. Sprenger et al. (45) found a lower incidence at 2 y of age (P < 0.05) for IgE-associated eczema in cesarean-delivered infants who were fed breast milk containing higher amounts of 2'-FL. HMOs have been shown to affect cytokine production and activation of human cord blood–derived T cells in vitro (46). Binding of 2'-FL to DC-SIGN and reduced inflammatory cytokines in vivo may explain, in part, the 2'-FL–associated reduction in eczema. Further investigation, however, is required to elucidate the involvement of 2'-FL in reducing the incidence of eczema.
In our study, we altered the GOS concentrations to achieve the same total prebiotic amount of 2.4 g/L. We believed this would be less confounding than adding 2'-FL to a constant amount of GOS, which could result in a simple ‘‘more is better’’ scenario. Switching out only 0.2 g/L (~8%) of GOS for 2'-FL resulted in a significant difference from GOS alone, suggesting that beneficial effects are due to the addition of 2'-FL rather than the decrease in GOS.
Our study has several limitations. First, although many differences were significant, the small group sizes limit the interpretation of the results. Additional power and sample sizes would have strengthened our understanding of the changes we observed. Second, we did not determine the secretor status of the infants. It would be interesting in the future to determine if secretor status has any effect on the immune modulation produced by dietary 2'-FL, and it may also provide additional insight into the mechanism of action. Last, we measured changes at one time point. Additional time points, including baseline measurements, may enable the determination of any changes in the rate of immune development and the effect of duration of exposure.
In conclusion, feeding a single HMO (2'-FL), in the context of infant formula, modified innate and adaptive immune profiles to be more like that of a BF reference group. These findings indicate that 2'-FL fortification supports aspects of immune development and regulation similar to that in a BF reference group of infants. Additional research is needed to fully understand the biological mechanisms underlying these changes.
If you liked this post you may also like